.png)

Tactical Trends: International Equity and Value Lead, US Growth Slips
42 of 58 equity ETFs beat S&P 500 SPY; ex-US and low vol lead.
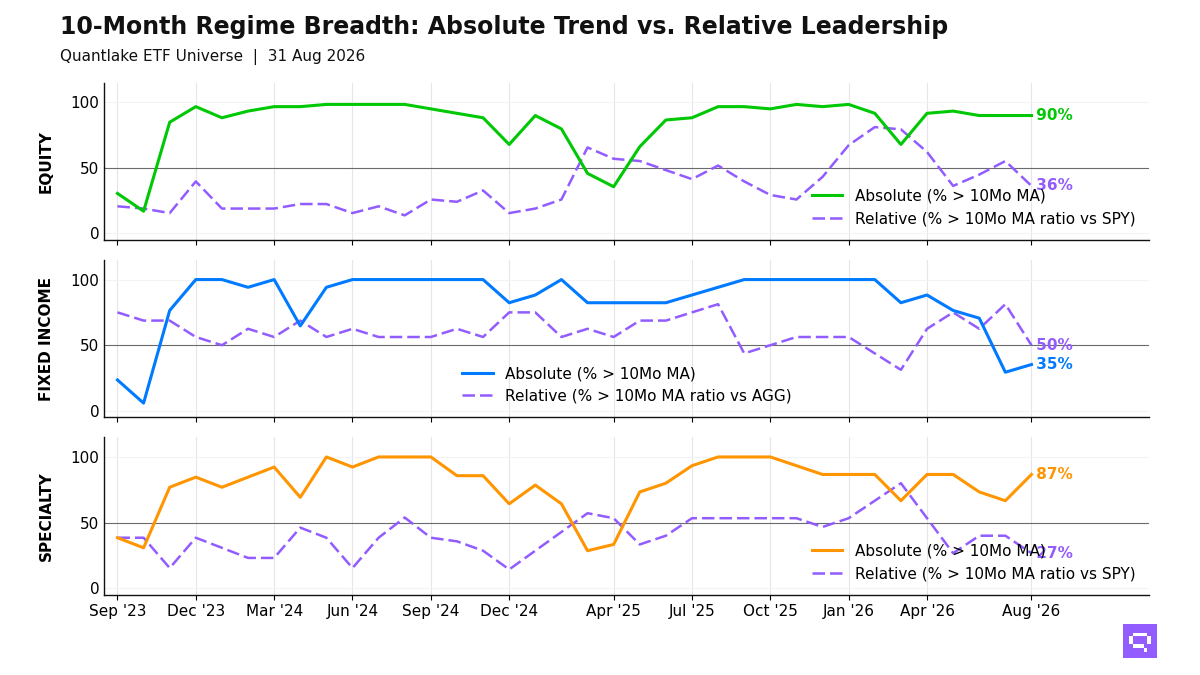
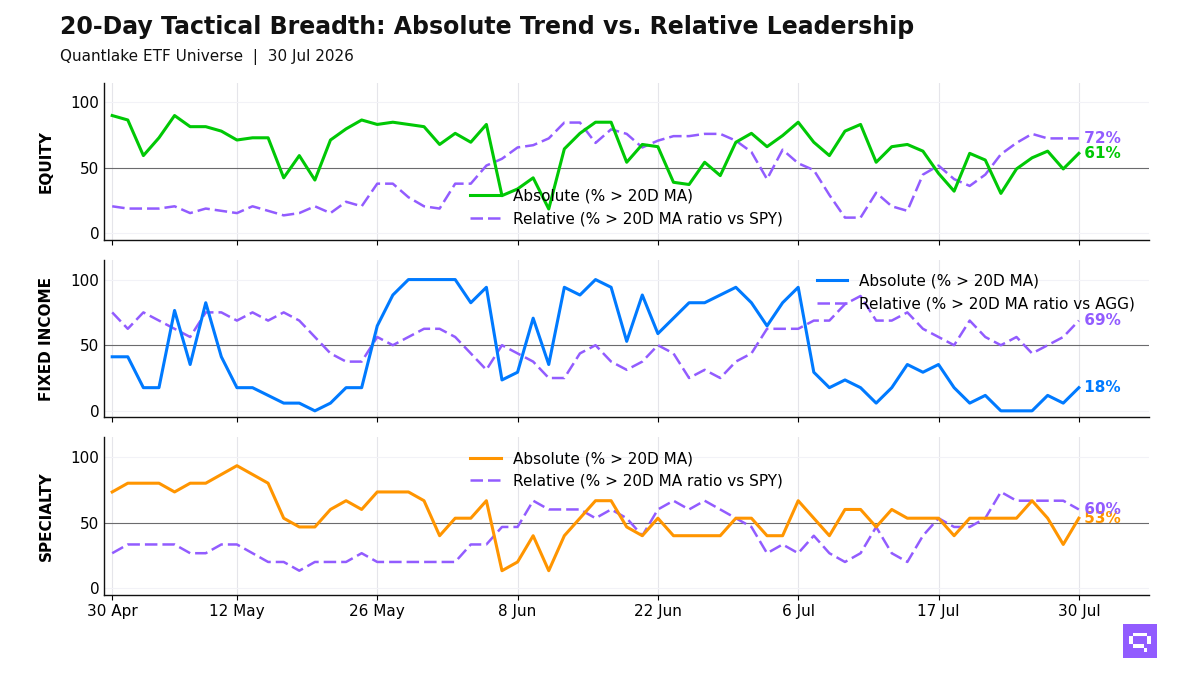
Defensive and international equity leadership defines July 30 at the close, with 36 of 59 equity ETFs (61%, +11.9pp on the day) above their 20-day moving average 20D MA and 42 of 58 (72%, unchanged on the day) above their 20-day ratio moving average versus S&P 500 SPY 20D ratio MA vs SPY. Low-volatility, developed ex-US, and value lead. US growth, Taiwan, and broader emerging markets lag. The equity regime is broad on both measures, and the negative 11pp price-relative gap places relative leadership ahead of price confirmation.
Fixed income leadership is narrow in price terms: 3 of 17 bond ETFs are above their 20D MA, concentrated in Preferred Stock PFF and short duration. Relative winners versus Aggregate Bonds AGG cluster in high yield, intermediate Treasuries, and short duration. Long duration and investment grade lag. Bond leadership is defensive on price and spread-oriented on a relative basis.
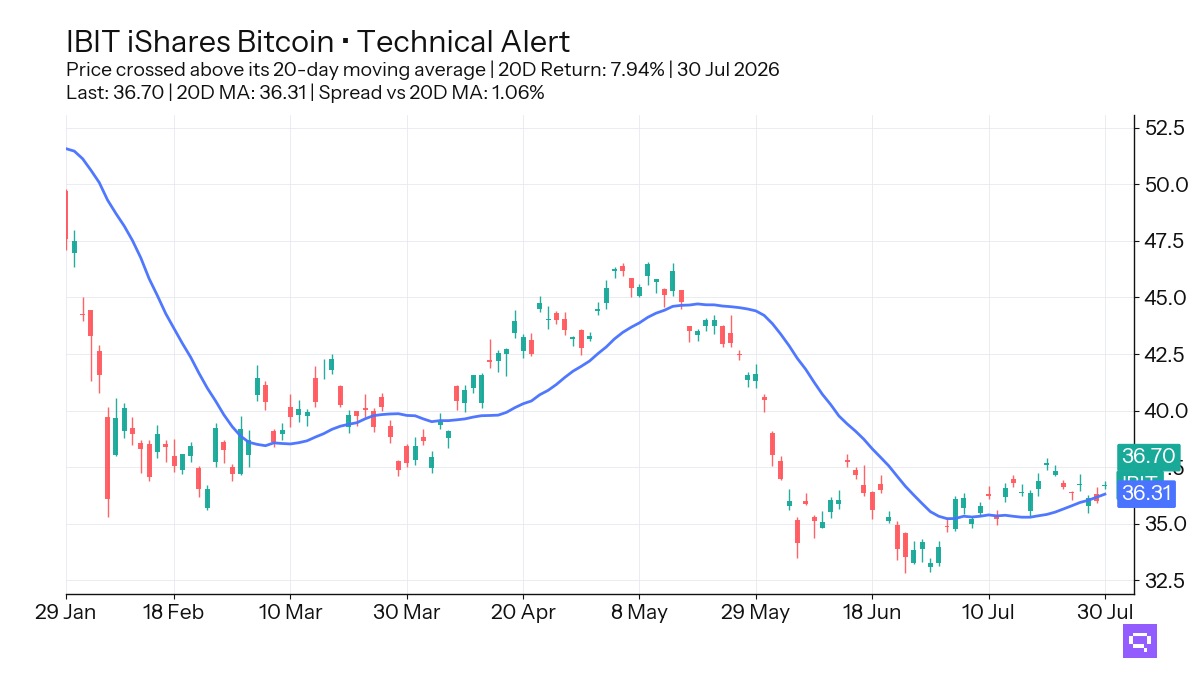
Specialty and commodities skew toward real assets: 8 of 15 specialty ETFs are above their 20D MA, with crypto, precious metals, and real estate in the leader cluster. Bitcoin Trust IBIT and Gold GLD crossed above their 20D MA. Biotechnology and semiconductors lag S&P 500 SPY on a relative basis, and agriculture lost relative ground versus SPY. The specialty and commodity mix is selective and real-asset heavy.
20-Day Tactical Breadth
Key Takeaways
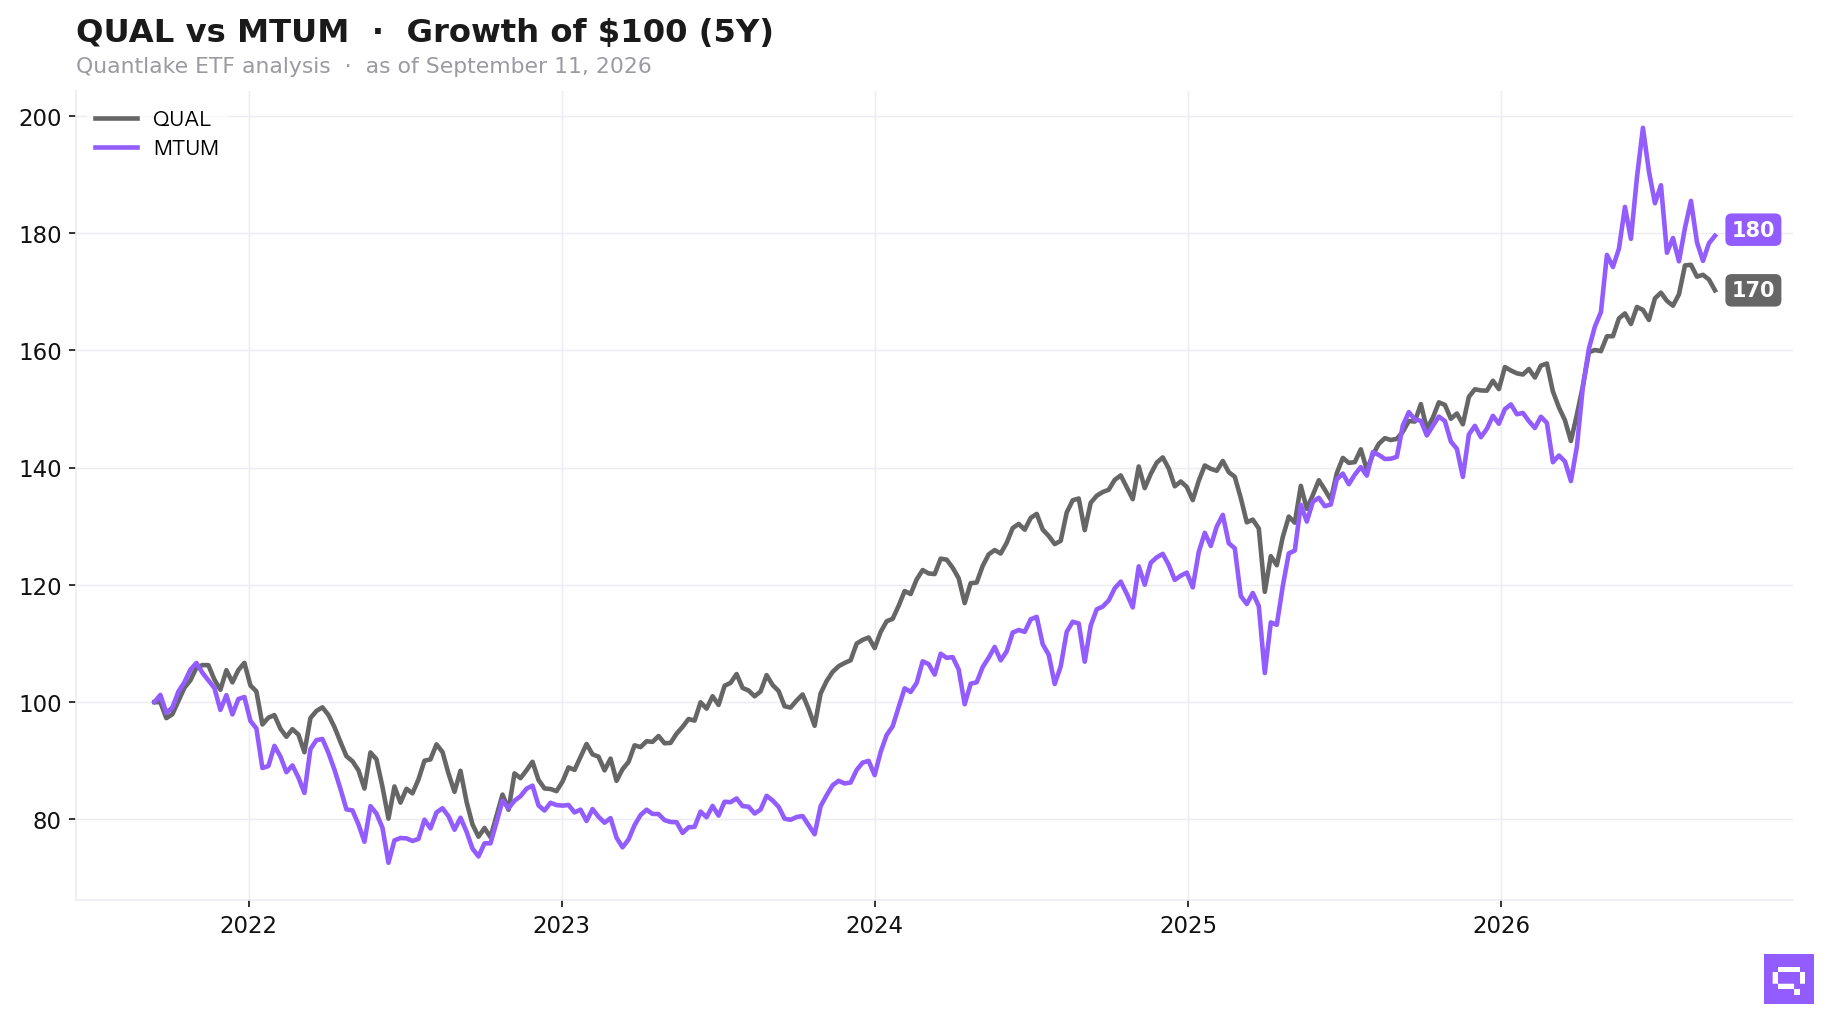
Bitcoin Trust IBIT, up 7.94% over the trailing 20-day window, crossed above its 20-day moving average. Gold Miners GDX and Gold GLD also crossed above their 20-day moving averages. The specialty leader cluster centers on crypto and precious metals.
Japan EWJ crossed above its 20-day ratio moving average versus S&P 500 SPY, and Intl Momentum IMTM and Value Factor VLUE crossed above their 20-day ratio moving averages versus SPY. Russell 2000 IWM, US Broad Market VTI, and Communication Services XLC crossed below their 20-day ratio moving averages versus SPY. The relative rotation favors developed international and value exposures over broad US beta.
Preferred Stock PFF crossed above both its 20-day moving average and its 20-day ratio moving average versus Aggregate Bonds AGG, and High Yield Bonds JNK crossed above its 20-day ratio moving average versus AGG. Cross-timescale bond leaders cluster in short duration, high yield, and intermediate Treasuries, and long duration and investment grade fill the laggard cluster. The bond distribution separates spread exposure from rate-sensitive duration.
FEATURED ETF: iShares Bitcoin IBIT
Other Technical Signal Events
Equity: Price vs 20-day MA
| Signal | Ticker | Name | 20D perf |
|---|---|---|---|
| Cross-up | VLUE | iShares MSCI USA Value Factor ETF | -1.09% |
| Cross-up | IMTM | iShares MSCI Intl Momentum Factor ETF | -0.50% |
| Cross-up | QUAL | iShares MSCI USA Quality Factor ETF | unch. |
| Cross-up | EWJ | iShares MSCI Japan ETF | +0.26% |
| Cross-up | URTH | iShares MSCI World ETF | +0.45% |
| Cross-up | VEA | Vanguard FTSE Developed Markets Index ETF | +1.04% |
| Cross-up | EFA | iShares MSCI EAFE ETF | +3.13% |
| Cross-up | COPX | Global X Copper Miners ETF | +5.59% |
| Cross-down | SLYV | SPDR S&P 600 Small Cap Value ETF | -0.51% |
Equity vs SPY: Price Ratio vs 20-day MA
| Signal | Ticker | Name | 20D rel perf |
|---|---|---|---|
| Cross-up | VLUE | iShares MSCI USA Value Factor ETF | -0.55% |
| Cross-up | IMTM | iShares MSCI Intl Momentum Factor ETF | unch. |
| Cross-up | VT | Vanguard Total World Stock Index ETF | +0.12% |
| Cross-up | EWJ | iShares MSCI Japan ETF | +0.81% |
| Cross-down | XLU | Utilities Select Sector | +0.30% |
| Cross-down | VTI | Vanguard Total Stock Market Index ETF | -0.27% |
| Cross-down | IWM | iShares Russell 2000 ETF | -1.71% |
| Cross-down | XLC | Communication Services Select Sector | -2.35% |
Fixed Income: Price vs 20-day MA
| Signal | Ticker | Name | 20D perf |
|---|---|---|---|
| Cross-up | PFF | iShares Preferred and Income Securities ETF | unch. |
| Cross-up | VCSH | Vanguard Short-Term Corporate Bond Index ETF | unch. |
Fixed Income vs AGG: Price Ratio vs 20-day MA
| Signal | Ticker | Name | 20D rel perf |
|---|---|---|---|
| Cross-up | JNK | SPDR Bloomberg High Yield Bond ETF | +0.67% |
| Cross-up | PFF | iShares Preferred and Income Securities ETF | +0.80% |
Specialty: Price vs 20-day MA
| Signal | Ticker | Name | 20D perf |
|---|---|---|---|
| Cross-up | GLD | SPDR Gold | +1.77% |
| Cross-up | FTLS | First Trust Long/Short Equity ETF | +2.16% |
| Cross-up | GDX | VanEck Gold Miners ETF | +2.28% |
| Cross-up | IBIT | iShares Bitcoin | +7.94% |
| Cross-down | DBMF | iMGP DBi Managed Futures Strategy ETF | +1.05% |
Specialty vs SPY: Price Ratio vs 20-day MA
| Signal | Ticker | Name | 20D rel perf |
|---|---|---|---|
| Cross-down | IBB | iShares Biotechnology ETF | +0.46% |
Commodities: Price vs 20-day MA
| Signal | Ticker | Name | 20D perf |
|---|---|---|---|
| Cross-up | SLV | iShares Silver | -0.15% |
Commodities vs SPY: Price Ratio vs 20-day MA
| Signal | Ticker | Name | 20D rel perf |
|---|---|---|---|
| Cross-down | DBA | Invesco DB Agriculture | +2.87% |
Romain Gandon
CEO, Quantlake
Disclaimer: This article is for informational and educational purposes only and does not constitute investment advice. Past performance is not indicative of future results.