Tactical Market Trends: Value and Cyclicals Rejoin the Equity Advance
Cross-horizon equity alignment is 44%, with emerging markets and growth lagging
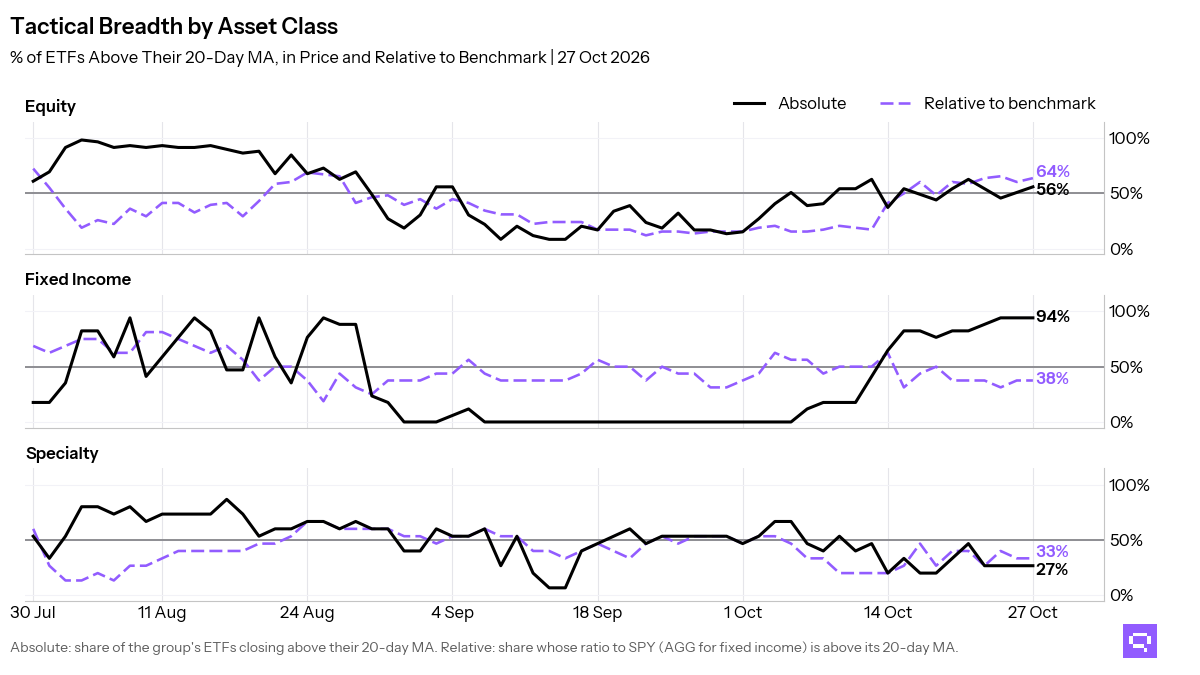
Equity participation broadened into value, developed markets, and cyclicals at the close on October 28. Price breadth stands at 38 of 59 ETFs (64%, +8.5pp) above their 20-day moving averages (20D MA), and 37 of 58 (64%, unchanged on the day) outperform the S&P 500 SPY. Developed Markets VEA crossed above its price MA and ratio MA vs benchmark. Its 20-day return vs benchmark is down 1.63%. Intl Value IVLU crossed below its ratio MA after a 2.40% relative decline over the trailing 20-day window.
Fixed income price participation is broad, with 16 of 17 ETFs (94%) above their 20-day averages, and only 6 of 16 beat the Aggregate Bonds AGG. Long duration is 1 of 1 above its ratio MA vs benchmark. Short duration is 0 of 2. Munis and inflation-linked bonds fill out the relative leader set.
Specialty leadership is limited to infrastructure, real estate, and lower-volatility equity, with 5 of 15 ETFs above their ratio MAs vs the S&P 500 SPY. Managed Futures DBMF holds above its price MA and below its ratio MA vs benchmark. Oil and broad commodities lead the commodity field. Silver and agriculture lag.

Key Takeaways
Infrastructure PAVE, up 1.60% over the trailing 20-day window, crossed above its 20D MA. PAVE also crossed above its ratio MA vs the S&P 500 SPY.
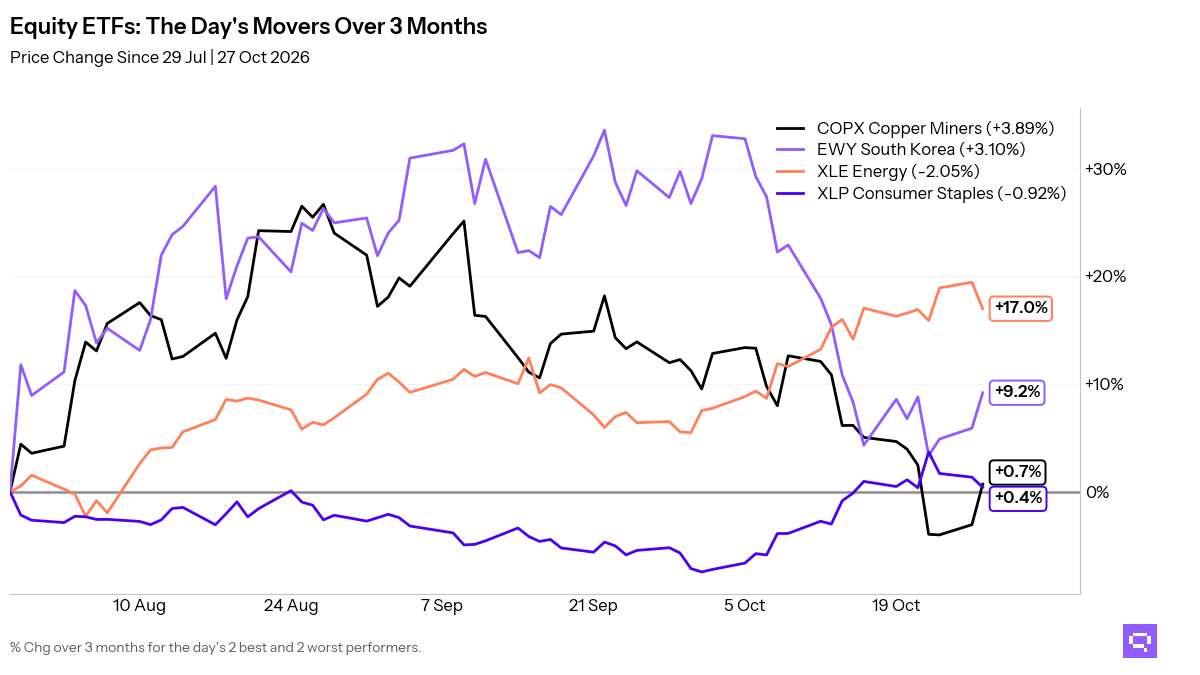
Dividend SCHD, Energy XLE, and Healthcare XLV lead the cross-timescale relative rankings vs the S&P 500 SPY. Emerging markets EEM and China FXI anchor the aligned laggard cluster. Alignment across daily, weekly, and monthly horizons is 44%.
Long duration is 1 of 1 above its ratio MA vs Aggregate Bonds AGG, and short duration is 0 of 2. Long Treasury TLT, Muni Broad MUB, and Inflation-Linked TIP lead the relative set. EM Debt EMB and Preferred PFF lag.
Featured ETF: Global X U.S. Infrastructure Development ETF PAVE

Technical Signals
Equity: Price vs 20-day MA
| Signal | Ticker | Name | 20D perf |
|---|---|---|---|
| Cross-up | VEA | Vanguard FTSE Developed Markets Index ETF | -0.38% |
| Cross-up | VLUE | iShares MSCI USA Value Factor ETF | +0.31% |
| Cross-up | XLI | Industrial Select Sector | +0.90% |
| Cross-up | VTI | Vanguard Total Stock Market Index ETF | +1.32% |
Equity vs SPY: Price Ratio vs 20-day MA
| Signal | Ticker | Name | 20D rel perf |
|---|---|---|---|
| Cross-up | VEA | Vanguard FTSE Developed Markets Index ETF | -1.63% |
| Cross-down | IVLU | iShares Edge MSCI Intl Value Factor ETF | -2.40% |
Specialty: Price vs 20-day MA
| Signal | Ticker | Name | 20D perf |
|---|---|---|---|
| Cross-up | DBMF | iMGP DBi Managed Futures Strategy ETF | +1.23% |
| Cross-up | PAVE | Global X U.S. Infrastructure Development ETF | +1.60% |
Specialty vs SPY: Price Ratio vs 20-day MA
| Signal | Ticker | Name | 20D rel perf |
|---|---|---|---|
| Cross-up | PAVE | Global X U.S. Infrastructure Development ETF | +0.33% |
| Cross-down | FTLS | First Trust Long/Short Equity ETF | -0.46% |
Related
- SPY candlestick signals: forward returns by pattern and sentiment
- Fear and greed: today's market sentiment reading
- ETF trend metrics explained
Romain Gandon
CEO, Quantlake
Disclaimer: This article is for informational and educational purposes only and does not constitute investment advice. Past performance is not indicative of future results.