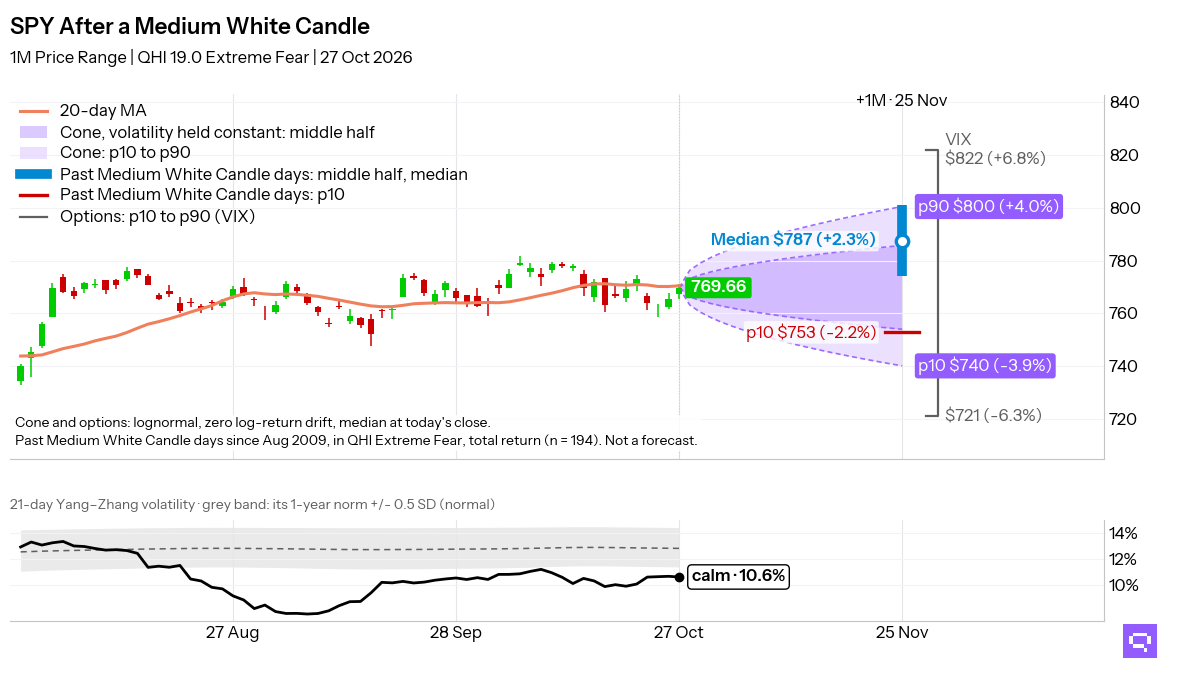
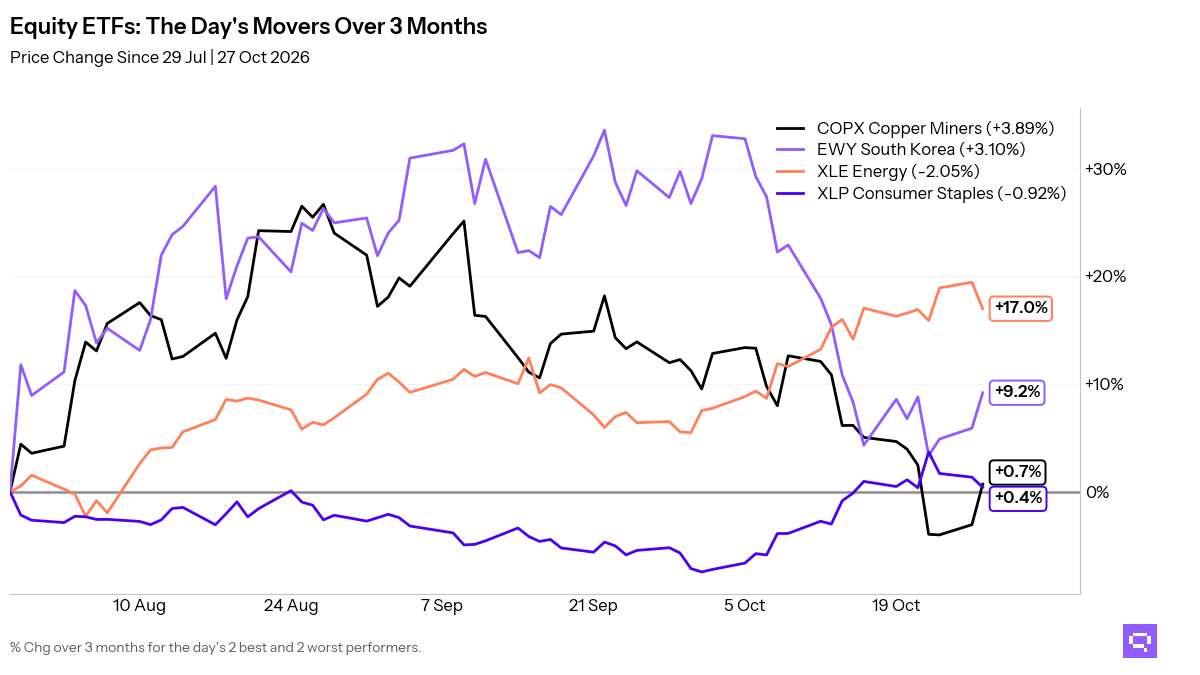
Tactical Market Trends: Developed Markets and Small Caps Reclaim Ground
Relative equity breadth rose to 64%, led by low-volatility and equal-weight.
Equity rotation into developed markets and small caps defines the October 27 close. Thirty-three of 59 equity ETFs (56%, +5.1pp) closed above their 20-day moving average (20D MA), and 37 of 58 (64%, +3.5pp) closed above their ratio MAs vs the S&P 500 SPY. Russell 2000 IWM and MSCI World URTH crossed above their price averages. Relative leadership runs 8pp ahead of price participation. Leadership clusters in five broad U.S. equity funds, two developed ex-US funds, and two low-volatility funds. Laggards include six China and broader Asia funds plus four U.S. growth and momentum names.
Fixed income relative leadership vs the Aggregate Bonds AGG is limited to 6 of 16 names. Long duration has one relative leader. Short duration has two relative laggards. High yield and EM debt also lag the benchmark.
Specialty relative leadership vs the S&P 500 SPY is limited to 5 of 15 names in REITs, biotech, and minimum volatility. Laggards include five gold and bitcoin proxy names plus momentum, semiconductors, and infrastructure. FTLS is a divergence, below its price MA and above its ratio MA vs the benchmark. Copper CPER crossed above its price MA and its ratio MA vs SPY.

Key Takeaways
Developed markets EFA, down 0.91% over the trailing 20-day window, crossed above its 20D MA. URTH also crossed above its price MA and its ratio MA vs the S&P 500 SPY.
Value factor VLUE, down 1.67% over the trailing 20-day window, crossed above its ratio MA vs the S&P 500 SPY. Industrials XLI, down 1.42% over the trailing 20-day window, crossed above its ratio MA vs the benchmark. Both sit in the equity divergence group, with price below their moving averages and ratio above their ratio MAs.
Cross-timescale fixed-income alignment is 18%. Bond relative leadership vs Aggregate Bonds AGG is concentrated in long duration, inflation-linked, mortgages, municipals, and one investment-grade fund. TIP is the lone relative leader across daily, weekly, and monthly reads.
Featured ETF: iShares MSCI EAFE ETF EFA

Technical Signals
Equity: Price vs 20-day MA
| Signal | Ticker | Name | 20D perf |
|---|---|---|---|
| Cross-up | EFA | iShares MSCI EAFE ETF | -0.91% |
| Cross-up | IWM | iShares Russell 2000 ETF | +0.42% |
| Cross-up | URTH | iShares MSCI World ETF | +0.43% |
Equity vs SPY: Price Ratio vs 20-day MA
| Signal | Ticker | Name | 20D rel perf |
|---|---|---|---|
| Cross-up | VLUE | iShares MSCI USA Value Factor ETF | -1.67% |
| Cross-up | XLI | Industrial Select Sector | -1.42% |
| Cross-up | URTH | iShares MSCI World ETF | -0.29% |
| Cross-down | INDA | iShares MSCI India ETF | -1.13% |
Commodities: Price vs 20-day MA
| Signal | Ticker | Name | 20D perf |
|---|---|---|---|
| Cross-up | CPER | United States Copper LP | +0.30% |
Commodities vs SPY: Price Ratio vs 20-day MA
| Signal | Ticker | Name | 20D rel perf |
|---|---|---|---|
| Cross-up | CPER | United States Copper LP | -0.41% |
Related
- SPY candlestick signals: forward returns by pattern and sentiment
- Fear and greed: today's market sentiment reading
- ETF trend metrics explained
Romain Gandon
CEO, Quantlake
Disclaimer: This article is for informational and educational purposes only and does not constitute investment advice. Past performance is not indicative of future results.