


.png)

Tactical Trends: Value and Emerging Markets Reclaim Price Support
Relative leadership outruns price participation by 14pp across our ETF universe
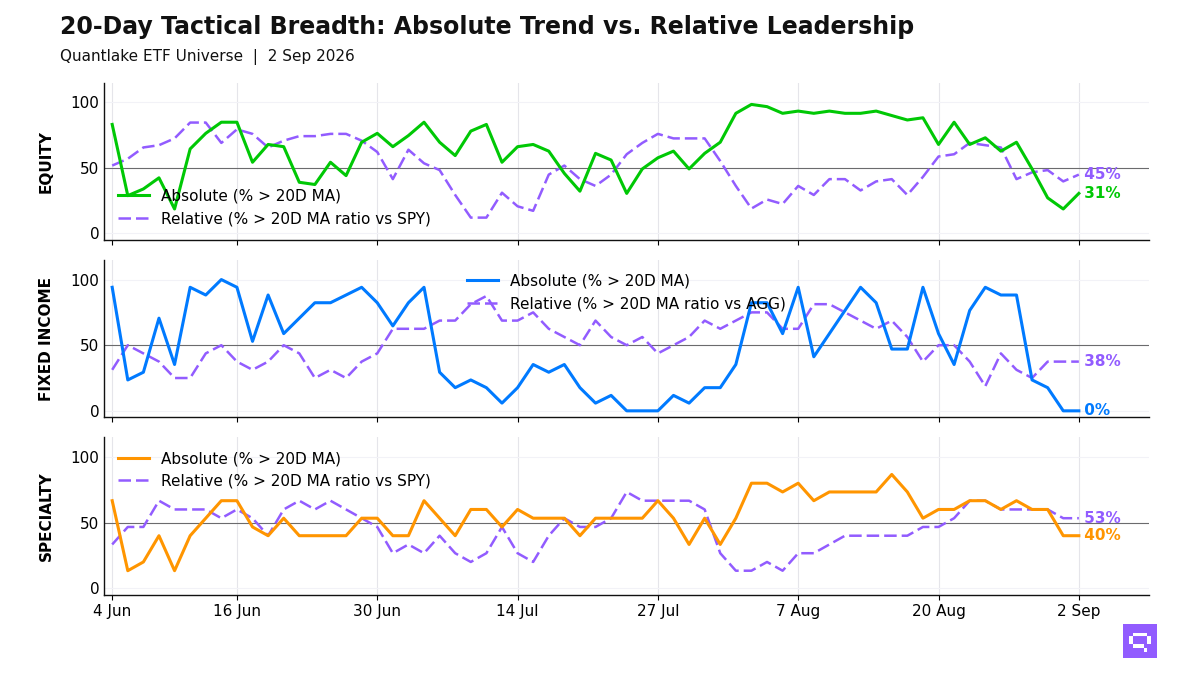
Dividend, value, and emerging-market equity regained footing by the September 2 close, with 18 of 59 equity ETFs (31%, +11.9pp on the day) above their 20-day moving average (20D MA) and 26 of 58 (45%, +5.2pp) outperforming the S&P 500 SPY on a ratio basis. Price winners cluster in dividend, value, and emerging markets. The divergent relative-leader bucket includes financials, consumer staples, and Asia-Pacific exposures below their price averages. The negative 14pp price-relative gap is consistent with defensive relative rotation and incomplete price confirmation.
Fixed income has 0 of 17 ETFs above their 20D MA. High yield, short duration, and TIPS outperform the Aggregate Bonds AGG. Long Treasury TLT joins that group, while core Treasuries and investment grade fill the laggard cluster. Leadership splits between stability and rate sensitivity. Price confirmation is absent.
Specialty leadership clusters in alternatives, crypto beta, and Gold Miners GDX, and clean energy with real estate lag the S&P 500 SPY. Commodities align with that resource-sensitive tilt through agriculture, broad commodities, and oil. Strength concentrates in hard-asset and alternative exposures.
20-Day Tactical Breadth
Key Takeaways
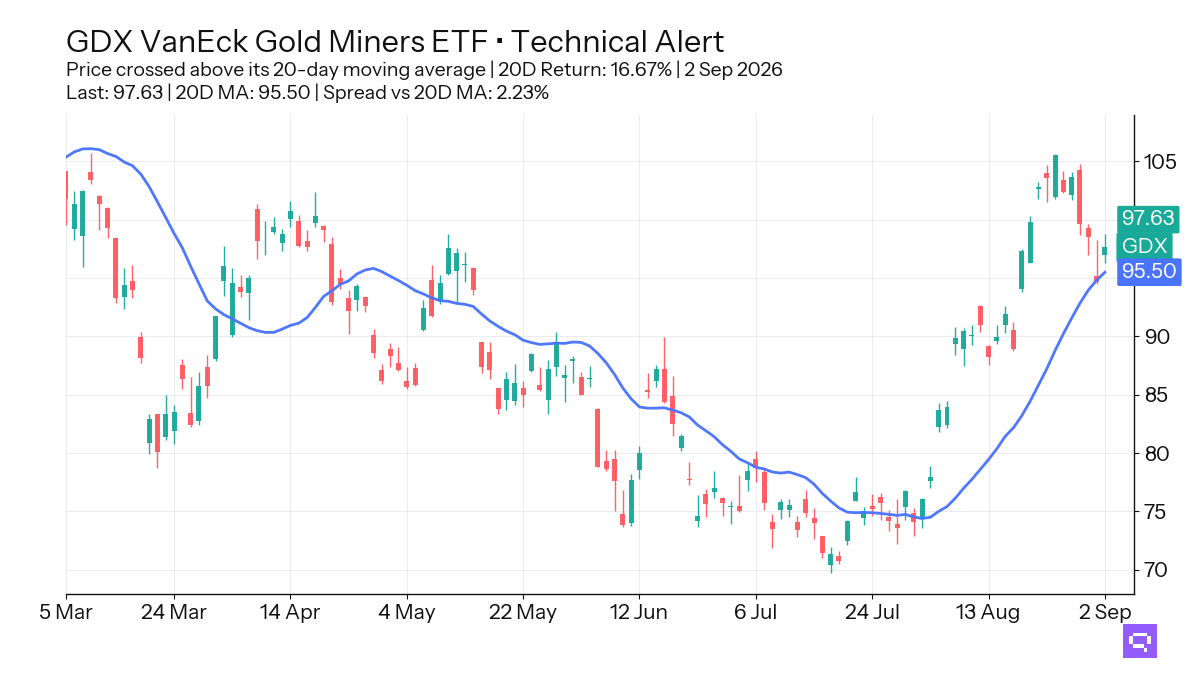
Precious-metals beta strengthened inside specialty. Gold Miners GDX, up 16.67% over the trailing 20-day window, crossed above its 20D MA. Agriculture DBA, broad commodities PDBC, and oil USO align with that resource cluster across timescales. Hard-asset leadership spans specialty and commodities.
Cross-timescale equity alignment is 27%, with Select Dividend DVY among the few names holding price leadership across daily, weekly, and monthly views. Intl Value IVLU and Value Factor VLUE anchor the relative leader cluster vs the S&P 500 SPY. Large-cap U.S. growth and Europe fill the laggard side. The alignment profile is selective and style-led.
Relative bond winners vs the Aggregate Bonds AGG cluster in high yield, short duration, and TIPS, and Long Treasury TLT also outperforms. International aggregate, core Treasuries, and investment grade fill the laggard cluster. The split pairs stability in short duration with rate sensitivity in TLT.
FEATURED ETF: VanEck Gold Miners ETF GDX
Other Technical Signal Events
Equity: Price vs 20-day MA
| Signal | Ticker | Name | 20D perf |
|---|---|---|---|
| Cross-up | FXI | iShares China Large-Cap ETF | -1.50% |
| Cross-up | INDA | iShares MSCI India ETF | -0.68% |
| Cross-up | XLB | Materials Select Sector | +0.59% |
| Cross-up | IVLU | iShares Edge MSCI Intl Value Factor ETF | +0.89% |
| Cross-up | XLC | Communication Services Select Sector | +1.40% |
| Cross-up | DVY | iShares Select Dividend ETF | +1.44% |
| Cross-up | VLUE | iShares MSCI USA Value Factor ETF | +2.40% |
Equity vs SPY: Price Ratio vs 20-day MA
| Signal | Ticker | Name | 20D rel perf |
|---|---|---|---|
| Cross-up | XLF | Financial Select Sector | unch. |
| Cross-up | XLB | Materials Select Sector | +1.20% |
| Cross-up | IMTM | iShares MSCI Intl Momentum Factor ETF | +1.25% |
| Cross-up | COPX | Global X Copper Miners ETF | +4.29% |
| Cross-down | EWU | iShares MSCI United Kingdom ETF | +0.29% |
Specialty: Price vs 20-day MA
| Signal | Ticker | Name | 20D perf |
|---|---|---|---|
| Cross-up | GDX | VanEck Gold Miners ETF | +16.67% |
| Cross-down | USMV | iShares MSCI USA Min Vol Factor ETF | +1.29% |
Romain Gandon
CEO, Quantlake
Disclaimer: This article is for informational and educational purposes only and does not constitute investment advice. Past performance is not indicative of future results.


