.png)

Tactical Trends: U.S. Growth Slips as Dividend and Ex-US Take the Lead
Price breadth now matches the income and international leader set.
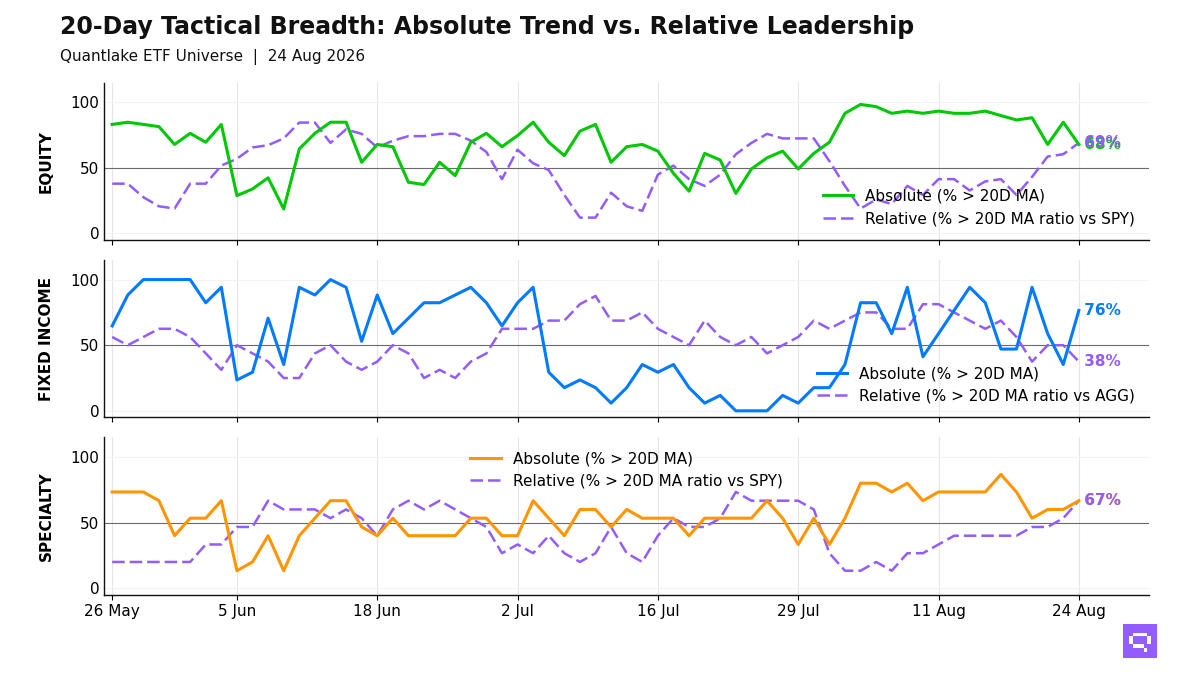
U.S. growth and small-cap weakness leads equity coverage on August 24, with 40 of 59 equity ETFs (68%, -17.0pp) above their 20-day moving average (20D MA) and 40 of 58 (69%, +8.6pp) above their 20-day ratio moving average vs S&P 500 SPY (20D ratio MA vs SPY). Nine laggards cluster in U.S. growth, small caps, China, and Japan, and 15 leaders span low-volatility, dividend, quality, Brazil, and developed ex-US exposure. The equity field aligns price participation with relative leadership in income, lower-volatility, and international themes.
Fixed income holds broad price participation, with 13 of 17 ETFs above 20D MA and 6 of 16 above 20D ratio MA vs Aggregate Bonds AGG. Relative leaders concentrate in high-yield credit, inflation-linked bonds, and Long Treasuries TLT, while U.S. Core Aggregate AGG, EM debt, intermediate Treasuries, and investment grade credit trade above 20D MA and lag the benchmark. Bond leadership concentrates in credit and selected duration.
Specialty leadership centers in hard assets and alternatives, with 10 of 15 above both 20D MA and 20D ratio MA vs S&P 500 SPY; gold, gold miners, bitcoin, and long/short equity fill the leader cluster, while clean energy, infrastructure, and semiconductors lag. Commodities add aligned strength in oil, broad commodities, and copper. The specialty and commodity book tilts toward hard assets and alternatives.
20-Day Tactical Breadth
Key Takeaways
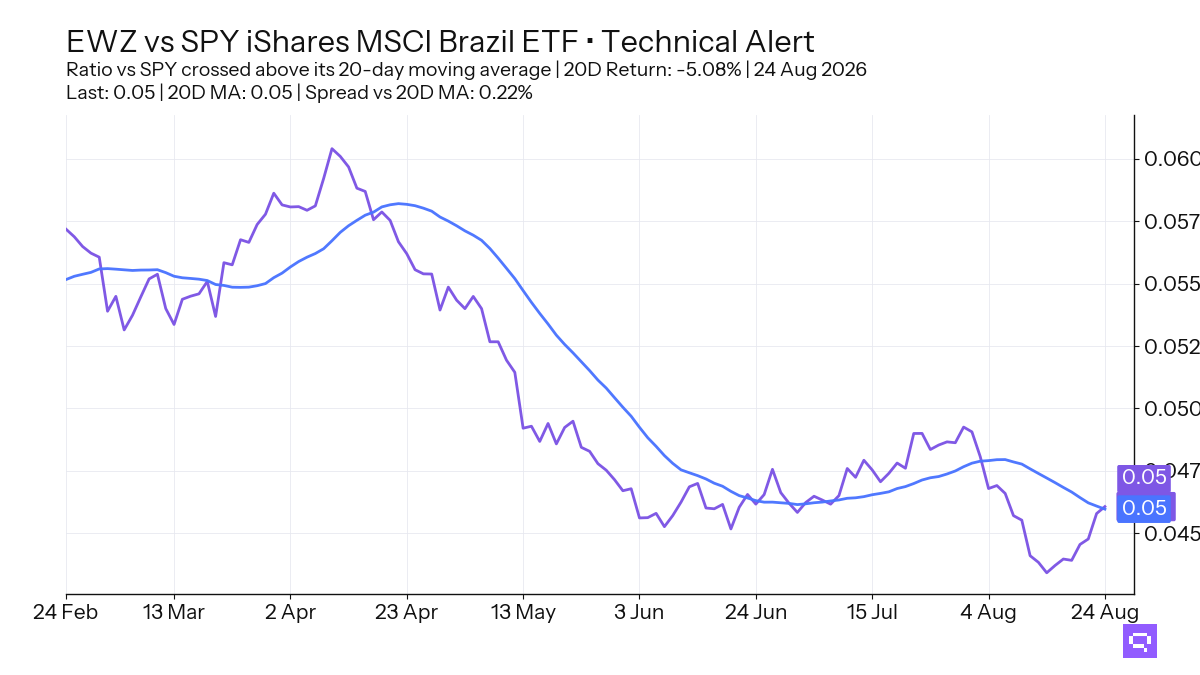
Brazil EWZ, down 1.95% over the trailing 20-day window, crossed above its 20-day moving average. EWZ also crossed above its 20D ratio MA versus S&P 500 SPY. Brazil moves into the aligned equity leader cluster.
Equity cross-timescale alignment is 64%, and Select Dividend DVY plus Quality Factor QUAL hold in the relative leader set versus S&P 500 SPY, while Japan EWJ and Russell Growth IWF anchor the laggard set. The aligned field favors income, quality, and ex-US exposure over U.S. growth.
Fixed-income cross-timescale alignment is 41%, and Long Treasuries TLT crossed above both its 20D MA and its 20D ratio MA versus Aggregate Bonds AGG, while 3-7yr Treasuries IEI and Int. Treasuries VGIT regained their 20D MA but fell below their 20D ratio MA versus AGG. The duration split rewards long duration more than the intermediate Treasury segment.
FEATURED ETF: iShares MSCI Brazil ETF EWZ
Other Technical Signal Events
Equity: Price vs 20-day MA
| Signal | Ticker | Name | 20D perf |
|---|---|---|---|
| Cross-up | EWZ | iShares MSCI Brazil ETF | -1.95% |
| Cross-up | XLF | Financial Select Sector | +2.36% |
| Cross-down | SPYG | S&P 500 Growth ETF | +4.18% |
| Cross-down | IYW | iShares U.S. Technology ETF | +3.85% |
| Cross-down | EWJ | iShares MSCI Japan ETF | +3.64% |
| Cross-down | QQQ | Invesco QQQ | +3.55% |
| Cross-down | IWF | iShares Russell 1000 Growth ETF | +3.34% |
| Cross-down | XLK | Technology Select Sector | +3.30% |
| Cross-down | VB | Vanguard Small-Cap Index ETF | +2.03% |
| Cross-down | IWM | iShares Russell 2000 ETF | +1.73% |
| Cross-down | SLYV | SPDR S&P 600 Small Cap Value ETF | +1.25% |
| Cross-down | MCHI | iShares MSCI China ETF | +1.23% |
| Cross-down | FXI | iShares China Large-Cap ETF | +0.77% |
Equity vs SPY: Price Ratio vs 20-day MA
| Signal | Ticker | Name | 20D rel perf |
|---|---|---|---|
| Cross-up | EWZ | iShares MSCI Brazil ETF | -5.08% |
| Cross-up | XLRE | The Real Estate Select Sector | -4.10% |
| Cross-up | DVY | iShares Select Dividend ETF | -2.38% |
| Cross-up | VYM | Vanguard High Dividend Yield Index ETF | -1.79% |
| Cross-up | VIG | Vanguard Dividend Appreciation Index ETF | -1.30% |
| Cross-up | XLF | Financial Select Sector | -0.91% |
| Cross-up | DIA | SPDR Dow Jones Industrial Average ETF | -0.81% |
| Cross-up | QUAL | iShares MSCI USA Quality Factor ETF | -0.28% |
| Cross-down | QQQ | Invesco QQQ | +0.24% |
| Cross-down | VB | Vanguard Small-Cap Index ETF | -1.23% |
| Cross-down | IWM | iShares Russell 2000 ETF | -1.52% |
Fixed Income: Price vs 20-day MA
| Signal | Ticker | Name | 20D perf |
|---|---|---|---|
| Cross-up | TLT | iShares 20+ Year Treasury Bond ETF | -1.02% |
| Cross-up | IEF | iShares 7-10 Year Treasury Bond ETF | unch. |
| Cross-up | LQD | iShares iBoxx $ Investment Grade Corporate Bond ETF | +0.12% |
| Cross-up | VGIT | Vanguard Intermediate-Term Treasury Index ETF | +0.28% |
| Cross-up | EMB | iShares J.P. Morgan USD Emerging Markets Bond ETF | +0.32% |
| Cross-up | IEI | iShares 3-7 Year Treasury Bond ETF | +0.36% |
Fixed Income vs AGG: Price Ratio vs 20-day MA
| Signal | Ticker | Name | 20D rel perf |
|---|---|---|---|
| Cross-up | TLT | iShares 20+ Year Treasury Bond ETF | -1.23% |
| Cross-down | VCSH | Vanguard Short-Term Corporate Bond Index ETF | +0.32% |
| Cross-down | IEI | iShares 3-7 Year Treasury Bond ETF | +0.16% |
| Cross-down | VGIT | Vanguard Intermediate-Term Treasury Index ETF | unch. |
Specialty: Price vs 20-day MA
| Signal | Ticker | Name | 20D perf |
|---|---|---|---|
| Cross-up | VNQ | Vanguard Real Estate Index ETF | -1.43% |
Specialty vs SPY: Price Ratio vs 20-day MA
| Signal | Ticker | Name | 20D rel perf |
|---|---|---|---|
| Cross-up | VNQ | Vanguard Real Estate Index ETF | -4.58% |
| Cross-up | FTLS | First Trust Long/Short Equity ETF | -2.00% |
Romain Gandon
CEO, Quantlake
Disclaimer: This article is for informational and educational purposes only and does not constitute investment advice. Past performance is not indicative of future results.