.png)

Tactical Trends: US Cyclicals Slip Below the 20-day MA at the Close
Relative winners cluster in defensive and developed ex-US ETFs.
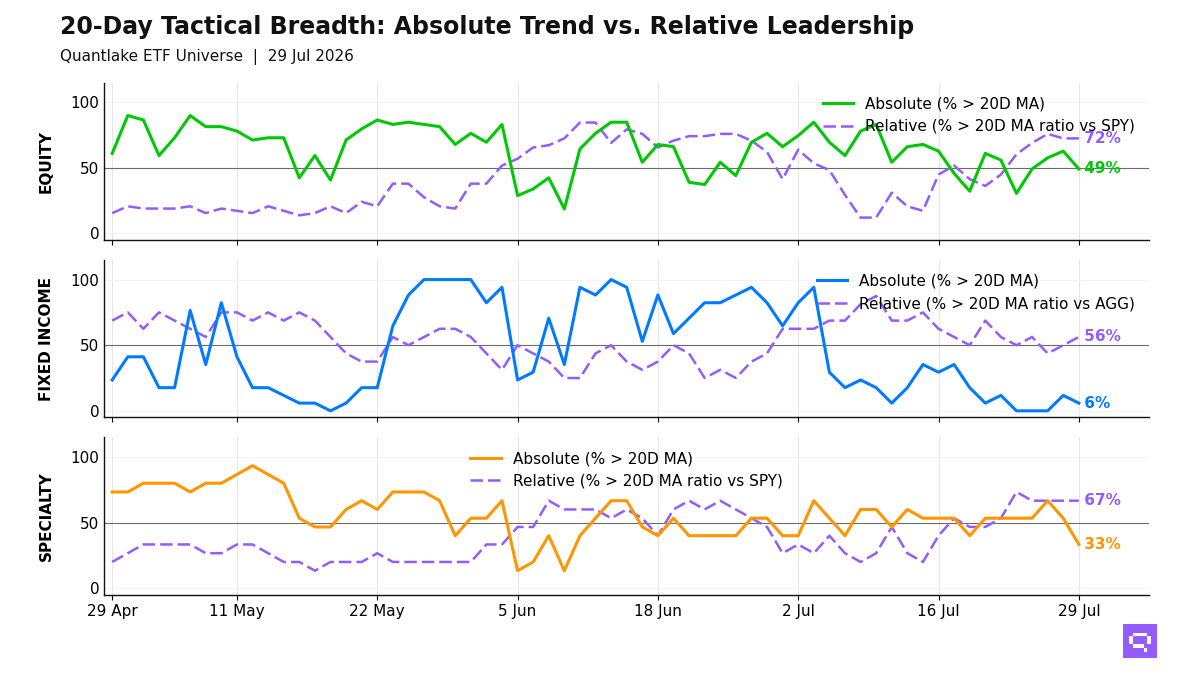
Cyclical equity exposure weakened at the close on July 29, with 29 of 59 equity ETFs (49%, -13.6pp on the day) above their 20-day moving average (20D MA) and 42 of 58 (72%, unchanged on the day) above their 20-day ratio moving average vs the S&P 500 SPY (20D ratio MA vs SPY). Small-cap, industrial, and growth exposure drive the price laggard cluster. Low-volatility, developed ex-US, and value-oriented exposures hold the relative leader cluster. The negative 23pp price-relative gap points to defensive relative rotation. Equity leadership is broader in relative terms than in price terms, so price confirmation is selective.
Fixed income price confirmation is limited to 1 of 17 ETFs, with Short TIPS VTIP the only name above its 20D MA, while short duration, intermediate Treasuries, and TIPS outperform the Aggregate Bonds AGG on a relative basis and High Yield HYG joins that group. Long Treasuries TLT and investment-grade credit fill the laggard cluster. Bond leadership concentrates in lower-duration and inflation-linked exposure.
Specialty relative strength vs the S&P 500 SPY concentrates in precious metals, real estate, and diversifiers, with 10 of 15 specialty ETFs ahead of the benchmark even as bitcoin, infrastructure, and momentum-linked equity proxies lose price confirmation or relative ground. Commodities split between agriculture, where Agriculture Basket DBA crossed below its 20D MA, and precious metals, where Silver SLV crossed above its 20D ratio MA vs SPY. Leadership concentrates in defensive and hard-asset pockets.
20-Day Tactical Breadth
Key Takeaways
Developed Markets VEA, down 0.93% versus the S&P 500 SPY over the trailing 20-day window, and US Broad Market VTI, down 0.29%, crossed above their 20D ratio MA versus SPY. The ratio turns mark early stabilization inside a 51% cross-timescale alignment regime led by developed ex-US and low-volatility exposure.
Short TIPS VTIP crossed above its 20D MA. High Yield HYG and TIPS TIP crossed above their 20D ratio MA versus the Aggregate Bonds AGG, and Long Treasuries TLT crossed below its 20D ratio MA versus AGG after a down 2.69% trailing 20-day relative return. The bond split favors lower duration and inflation protection over long rate sensitivity.
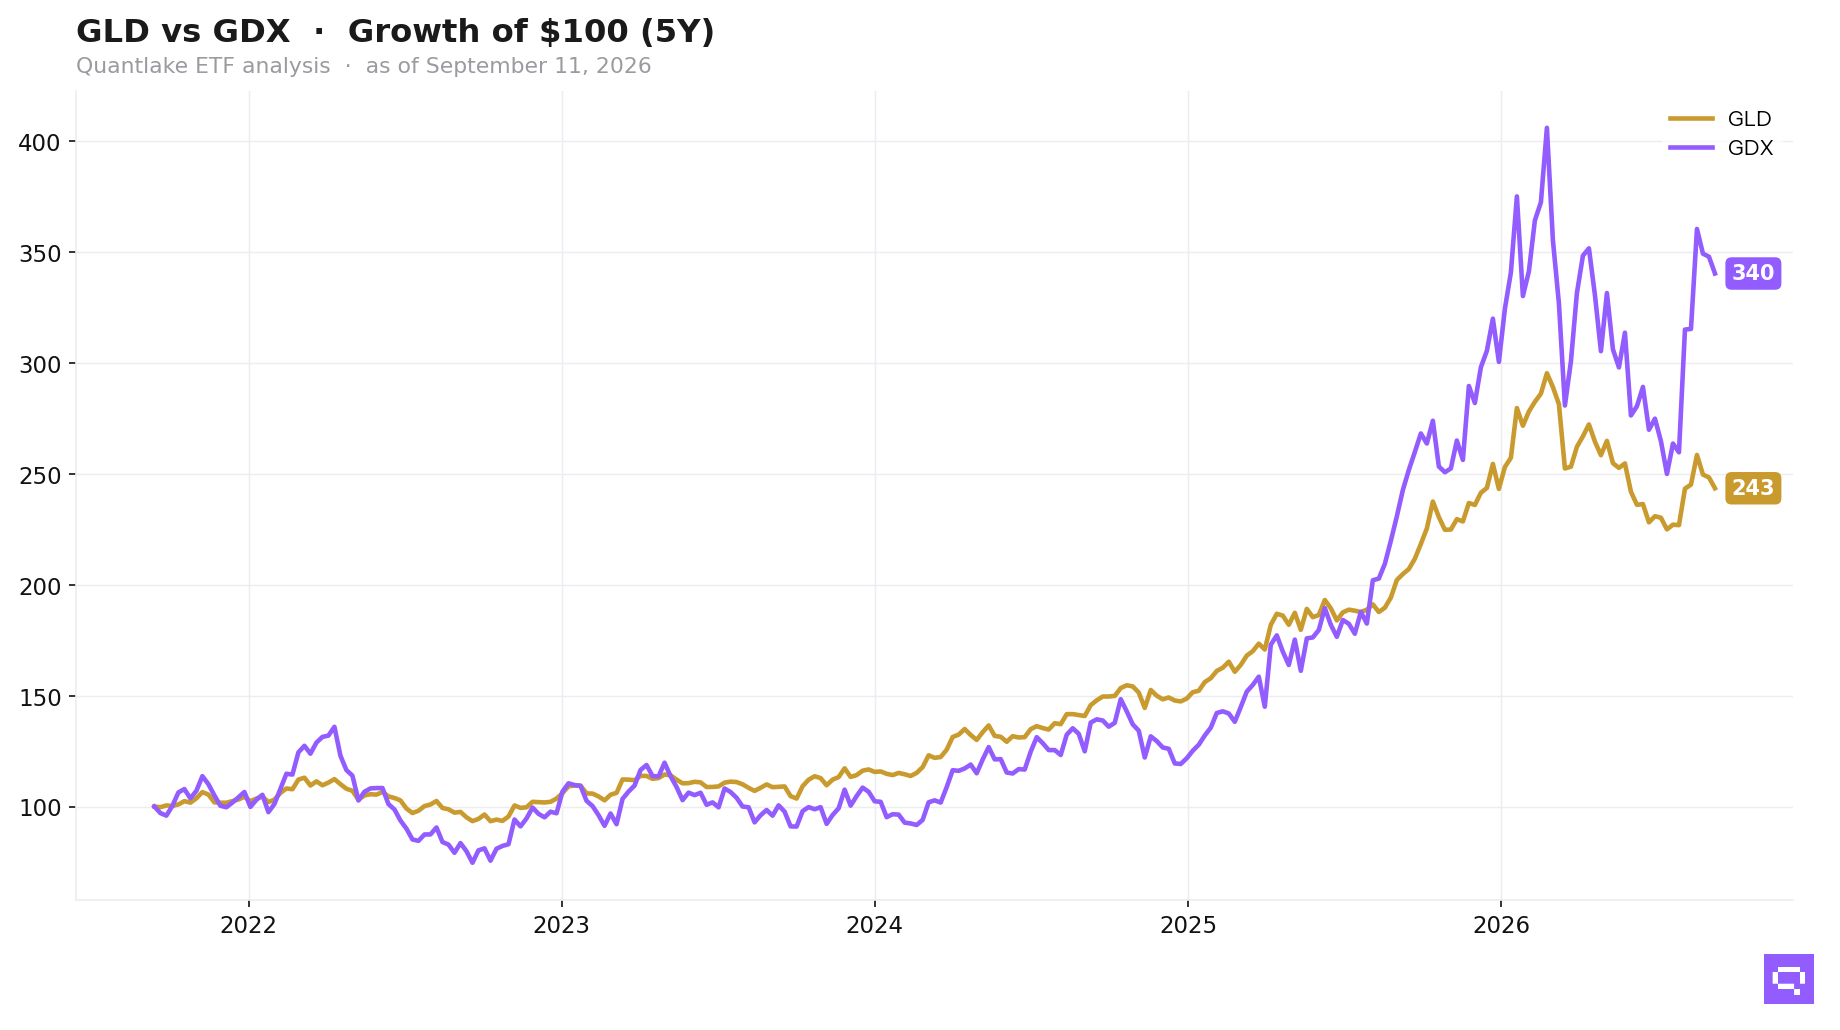
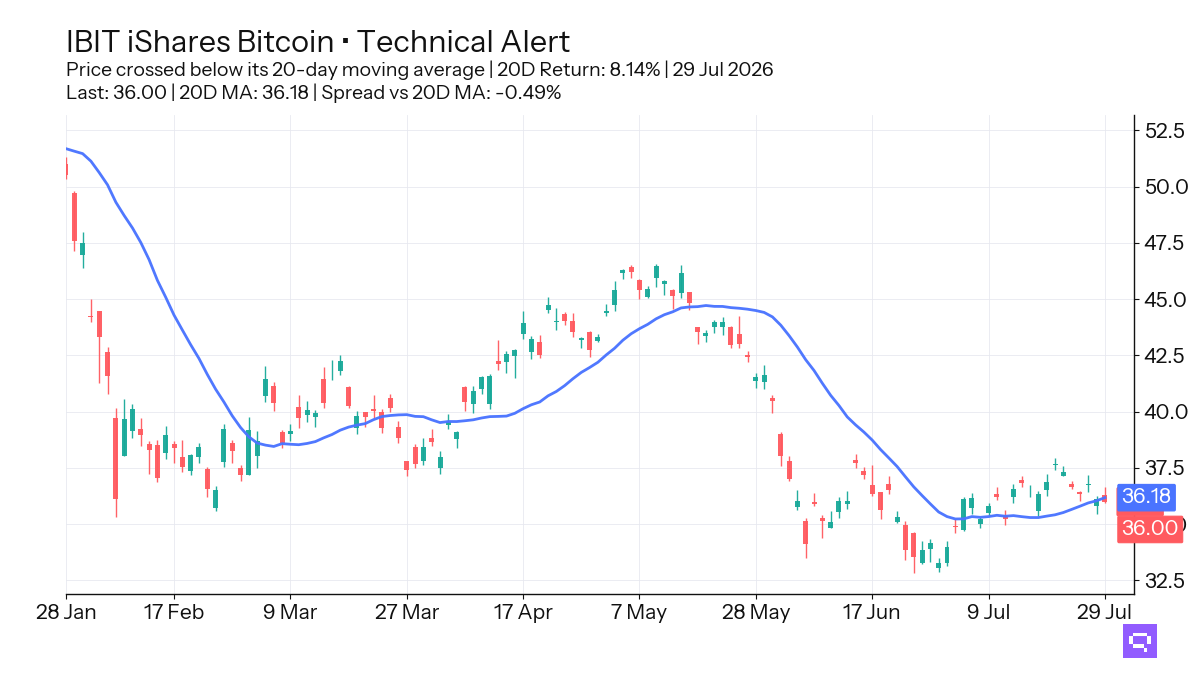
Bitcoin IBIT, up 8.14% over the trailing 20-day window, crossed below its 20-day moving average. Gold GLD crossed above its 20D ratio MA versus the S&P 500 SPY, and Infrastructure PAVE, down 4.46% versus SPY over the trailing 20-day window, crossed below its 20D ratio MA versus SPY. Specialty leadership concentrates in hard assets and away from equity-linked momentum.
FEATURED ETF: iShares Bitcoin IBIT
Other Technical Signal Events
Equity: Price vs 20-day MA
| Signal | Ticker | Name | 20D perf |
|---|---|---|---|
| Cross-down | EFA | iShares MSCI EAFE ETF | -0.49% |
| Cross-down | XLU | Utilities Select Sector | -0.95% |
| Cross-down | COPX | Global X Copper Miners ETF | -1.08% |
| Cross-down | DIA | SPDR Dow Jones Industrial Average ETF | -1.31% |
| Cross-down | QUAL | iShares MSCI USA Quality Factor ETF | -1.57% |
| Cross-down | IJR | iShares Core S&P Small-Cap ETF | -2.69% |
| Cross-down | VB | Vanguard Small-Cap Index ETF | -3.34% |
| Cross-down | XLI | Industrial Select Sector | -4.63% |
Equity vs SPY: Price Ratio vs 20-day MA
| Signal | Ticker | Name | 20D rel perf |
|---|---|---|---|
| Cross-up | VEA | Vanguard FTSE Developed Markets Index ETF | -0.93% |
| Cross-up | VTI | Vanguard Total Stock Market Index ETF | -0.29% |
| Cross-down | XLI | Industrial Select Sector | -2.36% |
| Cross-down | VLUE | iShares MSCI USA Value Factor ETF | -3.59% |
Fixed Income: Price vs 20-day MA
| Signal | Ticker | Name | 20D perf |
|---|---|---|---|
| Cross-up | VTIP | Vanguard Short-Term Inflation-Protected Securities Index ETF | +0.26% |
| Cross-down | MBB | iShares MBS ETF | -1.01% |
| Cross-down | BNDX | Vanguard Total International Bond Index ETF | -1.05% |
Fixed Income vs AGG: Price Ratio vs 20-day MA
| Signal | Ticker | Name | 20D rel perf |
|---|---|---|---|
| Cross-up | TIP | iShares TIPS Bond ETF | +0.56% |
| Cross-up | HYG | iShares iBoxx $ High Yield Corporate Bond ETF | +0.67% |
| Cross-down | TLT | iShares 20+ Year Treasury Bond ETF | -2.69% |
Specialty: Price vs 20-day MA
| Signal | Ticker | Name | 20D perf |
|---|---|---|---|
| Cross-down | IBIT | iShares Bitcoin | +8.14% |
| Cross-down | FTLS | First Trust Long/Short Equity ETF | +0.73% |
| Cross-down | PAVE | Global X U.S. Infrastructure Development ETF | -6.67% |
Specialty vs SPY: Price Ratio vs 20-day MA
| Signal | Ticker | Name | 20D rel perf |
|---|---|---|---|
| Cross-up | GLD | SPDR Gold | +3.12% |
| Cross-down | PAVE | Global X U.S. Infrastructure Development ETF | -4.46% |
Commodities: Price vs 20-day MA
| Signal | Ticker | Name | 20D perf |
|---|---|---|---|
| Cross-down | DBA | Invesco DB Agriculture | +3.07% |
Commodities vs SPY: Price Ratio vs 20-day MA
| Signal | Ticker | Name | 20D rel perf |
|---|---|---|---|
| Cross-up | SLV | iShares Silver | -0.88% |
Romain Gandon
CEO, Quantlake
Disclaimer: This article is for informational and educational purposes only and does not constitute investment advice. Past performance is not indicative of future results.