.png)

Tactical Trends: US Cyclicals Slip as International Leadership Rebuilds
Relative winners shift to ex-US, low-volatility, and value.
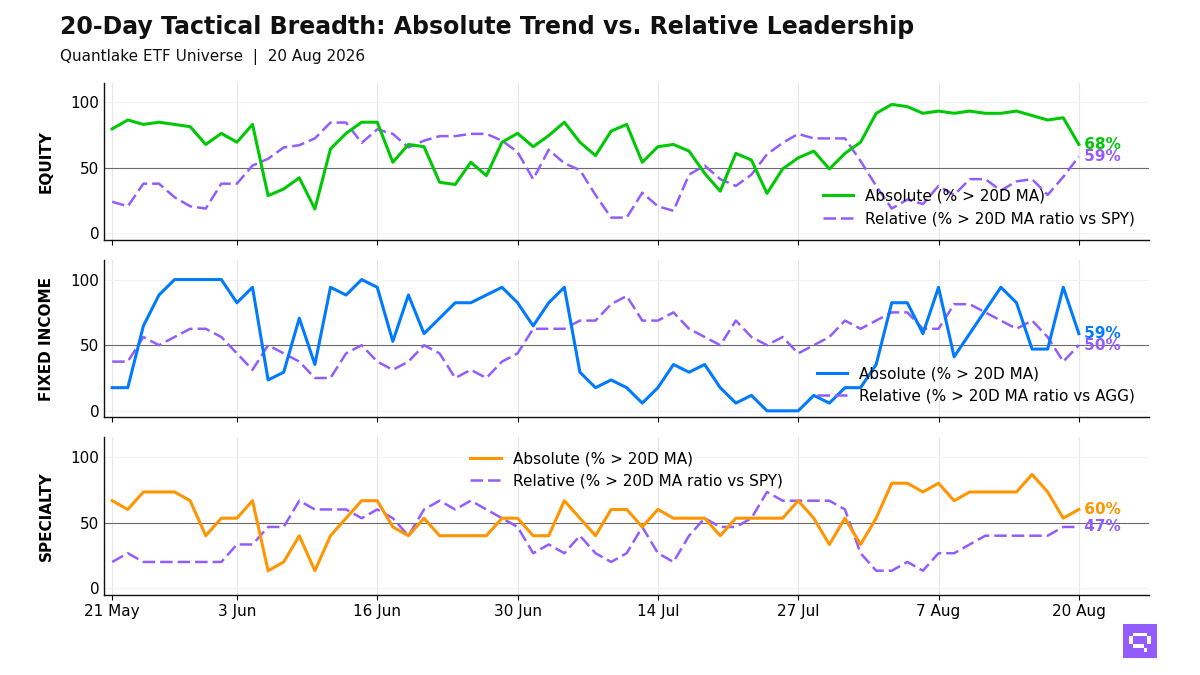
International leadership rebuilds at the close on August 20, even as US cyclicals lose price support. Across our ETF universe, 40 of 59 equity ETFs (68%, -20.3pp on the day) hold above their 20-day moving average (20D MA), and 34 of 58 (59%, +15.5pp) hold above their 20-day ratio moving average vs the S&P 500 SPY (20D ratio MA vs SPY). Developed ex-US, low-volatility, and value clusters lead vs the benchmark, while small caps, financials, and China fill the price laggards. The equity read is a rotation away from US size and cyclical beta, with a 9pp gap between price participation and relative leadership.
Fixed income leadership is limited to high-yield credit, intermediate duration, and TIPS. 8 of 16 hold above their 20D ratio MA vs the Aggregate Bonds AGG, while EM debt, investment-grade credit, and Long Treasuries TLT lag. Bond participation concentrates in shorter duration and selected credit. The weak flank is rate-sensitive duration.
Specialty leadership is limited to gold, crypto, and biotech proxies such as Gold Miners GDX and Bitcoin IBIT. 7 of 15 hold above their 20D ratio MA vs the S&P 500 SPY, while semiconductors, infrastructure, and real estate fill the laggard cluster. Commodity alignment centers on oil and broad commodities, with copper on the weak flank. The non-equity mix favors hard assets and low-volatility specialty exposure.
20-Day Tactical Breadth
Key Takeaways
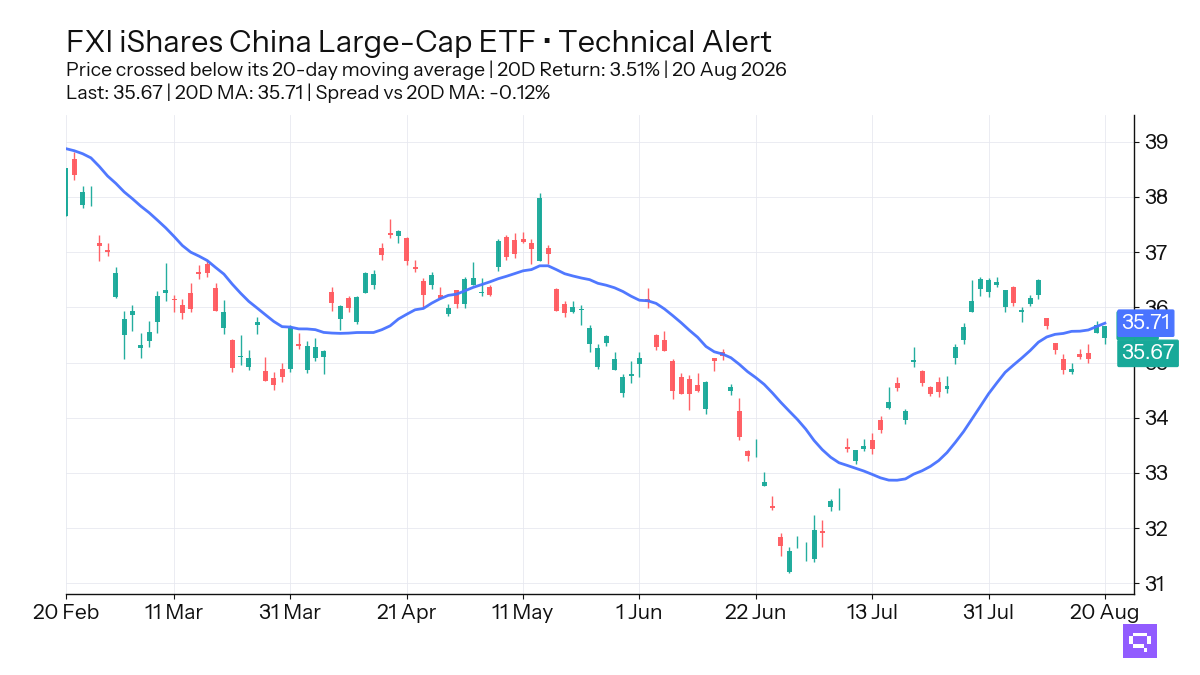
China Large Capitalization FXI, up 3.51% over the trailing 20-day window, crossed below its 20-day moving average. China MCHI, up 0.72% over the trailing 20-day window, crossed above its 20D ratio MA vs the S&P 500 SPY, so the China cluster splits between price weakness and relative improvement.
3-7yr Treasuries IEI and Short TIPS VTIP crossed above their 20D ratio MA vs the Aggregate Bonds AGG, and fixed-income cross-timescale alignment is 59%. 7-10yr Treasuries IEF and Long Treasuries TLT fill the laggard side, so bond strength concentrates in shorter duration and inflation-linked exposure, and the weak flank is rate-sensitive duration.
Managed Futures DBMF, down 1.05% over the trailing 20-day window, crossed above its 20D MA. DBMF also holds above its price MA and lags the S&P 500 SPY on a relative basis. Gold Miners GDX and Biotech IBB anchor the specialty leadership cluster, so hard assets lead and cyclical buildout themes lag.
FEATURED ETF: iShares China Large-Cap ETF FXI
Other Technical Signal Events
Equity: Price vs 20-day MA
| Signal | Ticker | Name | 20D perf |
|---|---|---|---|
| Cross-down | FXI | iShares China Large-Cap ETF | +3.51% |
| Cross-down | EWJ | iShares MSCI Japan ETF | +3.48% |
| Cross-down | QUAL | iShares MSCI USA Quality Factor ETF | +2.92% |
| Cross-down | XLP | Consumer Staples Select Sector | +2.54% |
| Cross-down | DIA | SPDR Dow Jones Industrial Average ETF | +2.18% |
| Cross-down | VIG | Vanguard Dividend Appreciation Index ETF | +2.10% |
| Cross-down | XLF | Financial Select Sector | +2.01% |
| Cross-down | IWM | iShares Russell 2000 ETF | +1.91% |
| Cross-down | VYM | Vanguard High Dividend Yield Index ETF | +1.69% |
| Cross-down | MDYG | SPDR S&P 400 Mid Cap Growth ETF | +1.60% |
| Cross-down | SLYV | SPDR S&P 600 Small Cap Value ETF | +1.40% |
| Cross-down | IJR | iShares Core S&P Small-Cap ETF | +1.03% |
Equity vs SPY: Price Ratio vs 20-day MA
| Signal | Ticker | Name | 20D rel perf |
|---|---|---|---|
| Cross-up | XLK | Technology Select Sector | -0.68% |
| Cross-up | SDY | SPDR S&P Dividend ETF | -0.59% |
| Cross-up | JEPI | JPMorgan Equity Premium Income ETF | -0.34% |
| Cross-up | VWO | Vanguard FTSE Emerging Markets Index ETF | unch. |
| Cross-up | IYW | iShares U.S. Technology ETF | +0.15% |
| Cross-up | URTH | iShares MSCI World ETF | +0.28% |
| Cross-up | EWU | iShares MSCI United Kingdom ETF | +0.61% |
| Cross-up | MCHI | iShares MSCI China ETF | +0.72% |
| Cross-up | IVLU | iShares Edge MSCI Intl Value Factor ETF | +0.77% |
| Cross-up | XLB | Materials Select Sector | +0.90% |
| Cross-up | EFA | iShares MSCI EAFE ETF | +0.98% |
| Cross-up | EFAV | iShares MSCI EAFE Min Vol Factor ETF | +1.12% |
| Cross-up | XLC | Communication Services Select Sector | +1.67% |
| Cross-down | VTI | Vanguard Total Stock Market Index ETF | unch. |
| Cross-down | VB | Vanguard Small-Cap Index ETF | -0.55% |
| Cross-down | XLP | Consumer Staples Select Sector | -0.75% |
| Cross-down | IWM | iShares Russell 2000 ETF | -1.35% |
Fixed Income: Price vs 20-day MA
| Signal | Ticker | Name | 20D perf |
|---|---|---|---|
| Cross-down | PFF | iShares Preferred and Income Securities ETF | +1.50% |
| Cross-down | EMB | iShares J.P. Morgan USD Emerging Markets Bond ETF | +0.59% |
| Cross-down | MUB | iShares National Muni Bond ETF | +0.47% |
| Cross-down | VCIT | Vanguard Intermediate-Term Corporate Bond Index ETF | +0.40% |
| Cross-down | LQD | iShares iBoxx $ Investment Grade Corporate Bond ETF | +0.24% |
| Cross-down | TLT | iShares 20+ Year Treasury Bond ETF | -0.60% |
Fixed Income vs AGG: Price Ratio vs 20-day MA
| Signal | Ticker | Name | 20D rel perf |
|---|---|---|---|
| Cross-up | VTIP | Vanguard Short-Term Inflation-Protected Securities Index ETF | unch. |
| Cross-up | VGIT | Vanguard Intermediate-Term Treasury Index ETF | +0.11% |
| Cross-up | VCSH | Vanguard Short-Term Corporate Bond Index ETF | +0.13% |
| Cross-up | IEI | iShares 3-7 Year Treasury Bond ETF | +0.16% |
| Cross-down | IEF | iShares 7-10 Year Treasury Bond ETF | unch. |
| Cross-down | TLT | iShares 20+ Year Treasury Bond ETF | -1.10% |
Specialty: Price vs 20-day MA
| Signal | Ticker | Name | 20D perf |
|---|---|---|---|
| Cross-up | DBMF | iMGP DBi Managed Futures Strategy ETF | -1.05% |
Romain Gandon
CEO, Quantlake
Disclaimer: This article is for informational and educational purposes only and does not constitute investment advice. Past performance is not indicative of future results.