.png)

Tactical Trends: US Beta Breaks as Low-Volatility and Ex-US Lead
Defensive and international leaders offset the US beta break
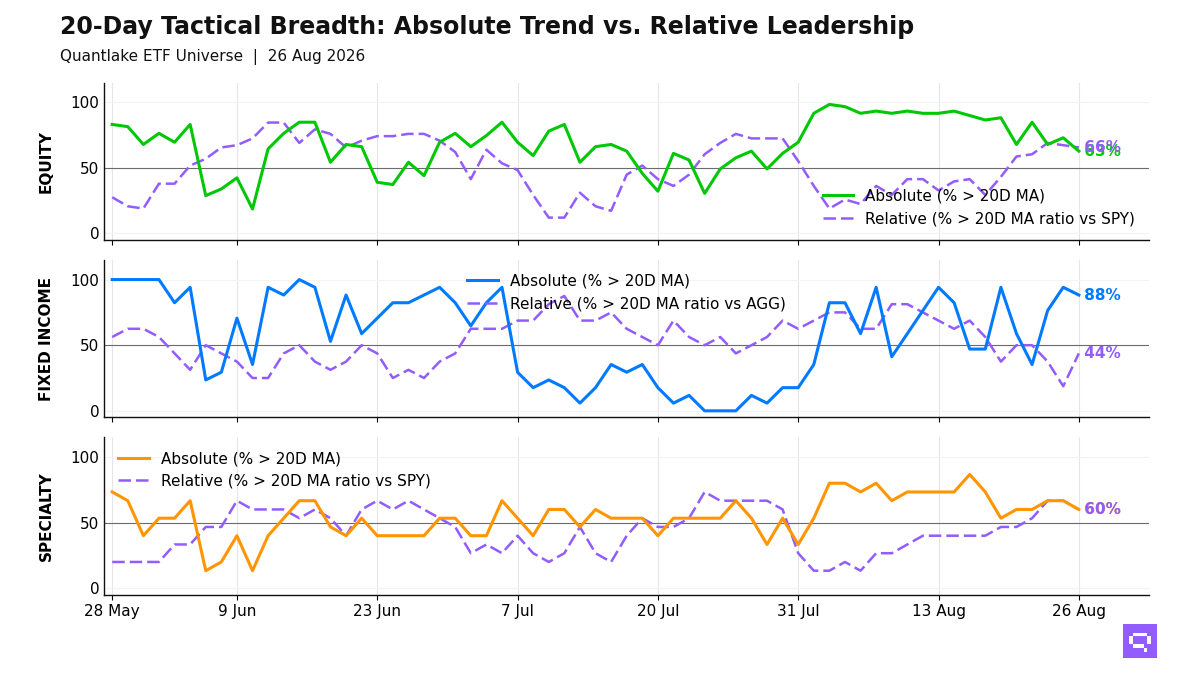
Equity participation is thinner at the August 26 close, with 37 of 59 equity ETFs (63%, -10.2pp on the day) holding above their 20-day moving average (20D MA) and 38 of 58 (66%, -1.7pp) holding above their 20-day ratio moving average versus the S&P 500 SPY (20D ratio MA vs SPY). Low-volatility, developed ex-US, and dividend/value leaders offset fresh breaks in US Broad Market VTI and Consumer Discretionary XLY. The -3pp price-relative gap shows alignment between price participation and relative leadership, and the equity cross-section across our ETF universe is selective.
Fixed income leadership is limited to credit and selective duration, with 7 of 16 bond ETFs outperforming the Aggregate Bonds AGG. EM Sovereign Bonds EMB and TIPS TIP joined high-yield credit in the relative leader cluster, while Treasuries, short duration, and municipals lagged. Bond participation concentrates in spread product and selective duration.
Specialty leadership is limited, with 9 of 15 names above their 20D MA and the relative winner cluster versus the S&P 500 SPY centered on gold, miners, biotech, and bitcoin, while Global REITs REET and semiconductor exposure lagged. Oil USO crossed above both its 20D MA and its 20D ratio MA versus SPY. Hard-asset strength is concentrated outside equity-linked specialty.
20-Day Tactical Breadth
Key Takeaways
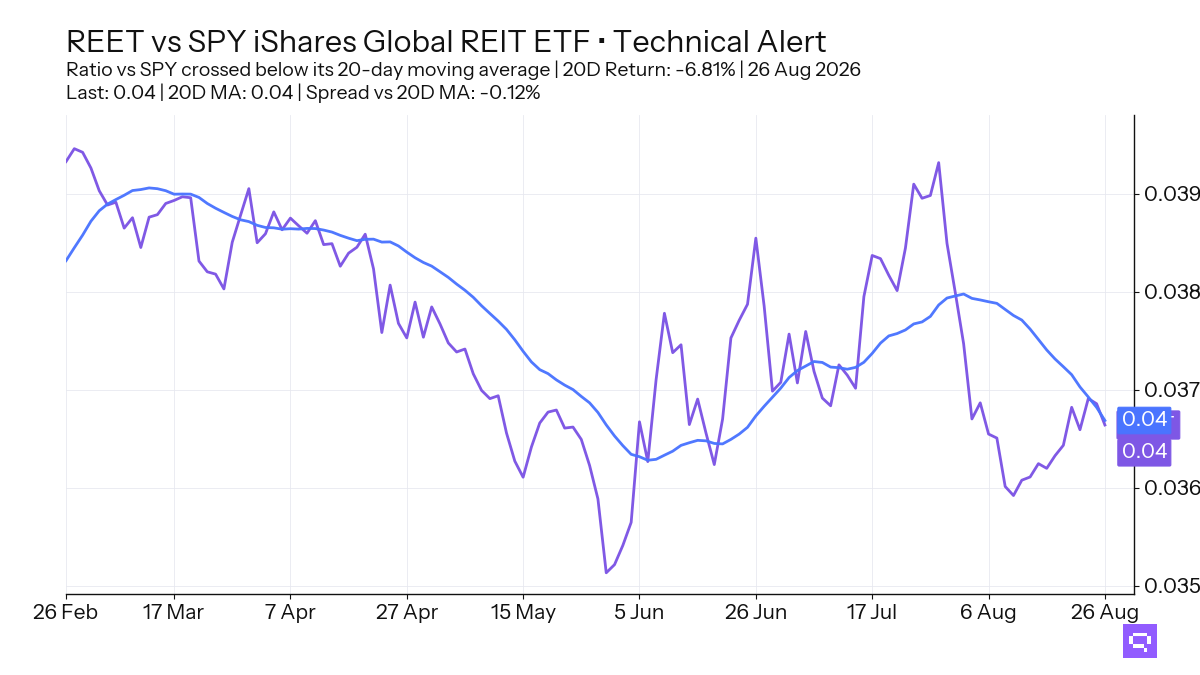
Global REITs REET, down 2.13% over the trailing 20-day window, crossed below its 20-day moving average. REET also crossed below its 20D ratio MA vs the S&P 500 SPY after a 20-day relative return down 6.81%; specialty real estate lost both absolute and relative position.
Small-Cap VB and Mid-Cap VO crossed above their 20D ratio MA vs the S&P 500 SPY even with 20-day relative returns down 1.22% and 1.83%. Russell 2000 IWM crossed below its 20D MA after a 20-day return up 3.59%. US size shows relative stabilization without full price confirmation.
High Yield HYG and High Yield Bonds JNK crossed above their 20D ratio MA vs the Aggregate Bonds AGG, and fixed-income cross-timescale alignment stands at 59% with long duration in the leader cluster while intermediate Treasuries and short duration lag. The bond cross-section rewards spread product and duration extension, with weaker participation in the middle of the rate complex.
FEATURED ETF: iShares Global REIT ETF REET
Other Technical Signal Events
Equity: Price vs 20-day MA
| Signal | Ticker | Name | 20D perf |
|---|---|---|---|
| Cross-up | VB | Vanguard Small-Cap Index ETF | +3.74% |
| Cross-down | EWJ | iShares MSCI Japan ETF | +6.80% |
| Cross-down | XLY | Consumer Discretionary Select Sector | +4.97% |
| Cross-down | VTI | Vanguard Total Stock Market Index ETF | +4.94% |
| Cross-down | QUAL | iShares MSCI USA Quality Factor ETF | +3.63% |
| Cross-down | IWM | iShares Russell 2000 ETF | +3.59% |
| Cross-down | INDA | iShares MSCI India ETF | +1.18% |
Equity vs SPY: Price Ratio vs 20-day MA
| Signal | Ticker | Name | 20D rel perf |
|---|---|---|---|
| Cross-up | VYM | Vanguard High Dividend Yield Index ETF | -2.82% |
| Cross-up | VO | Vanguard Mid-Cap Index ETF | -1.83% |
| Cross-up | VB | Vanguard Small-Cap Index ETF | -1.22% |
| Cross-down | EWJ | iShares MSCI Japan ETF | +1.70% |
| Cross-down | XLY | Consumer Discretionary Select Sector | unch. |
| Cross-down | QUAL | iShares MSCI USA Quality Factor ETF | -1.32% |
| Cross-down | INDA | iShares MSCI India ETF | -3.66% |
Fixed Income: Price vs 20-day MA
| Signal | Ticker | Name | 20D perf |
|---|---|---|---|
| Cross-down | BNDX | Vanguard Total International Bond Index ETF | +0.19% |
Fixed Income vs AGG: Price Ratio vs 20-day MA
| Signal | Ticker | Name | 20D rel perf |
|---|---|---|---|
| Cross-up | TIP | iShares TIPS Bond ETF | -0.17% |
| Cross-up | EMB | iShares J.P. Morgan USD Emerging Markets Bond ETF | +0.56% |
| Cross-up | HYG | iShares iBoxx $ High Yield Corporate Bond ETF | +0.65% |
| Cross-up | JNK | SPDR Bloomberg High Yield Bond ETF | +0.72% |
Specialty: Price vs 20-day MA
| Signal | Ticker | Name | 20D perf |
|---|---|---|---|
| Cross-down | REET | iShares Global REIT ETF | -2.13% |
Specialty vs SPY: Price Ratio vs 20-day MA
| Signal | Ticker | Name | 20D rel perf |
|---|---|---|---|
| Cross-down | REET | iShares Global REIT ETF | -6.81% |
Commodities: Price vs 20-day MA
| Signal | Ticker | Name | 20D perf |
|---|---|---|---|
| Cross-up | USO | United States Oil Fund LP | -1.52% |
Commodities vs SPY: Price Ratio vs 20-day MA
| Signal | Ticker | Name | 20D rel perf |
|---|---|---|---|
| Cross-up | USO | United States Oil Fund LP | -6.22% |
Romain Gandon
CEO, Quantlake
Disclaimer: This article is for informational and educational purposes only and does not constitute investment advice. Past performance is not indicative of future results.