.png)
Tactical Trends: Tech and Growth Reclaim the Equity Lead into the Close
Price breadth recovered faster than relative leadership vs SPY
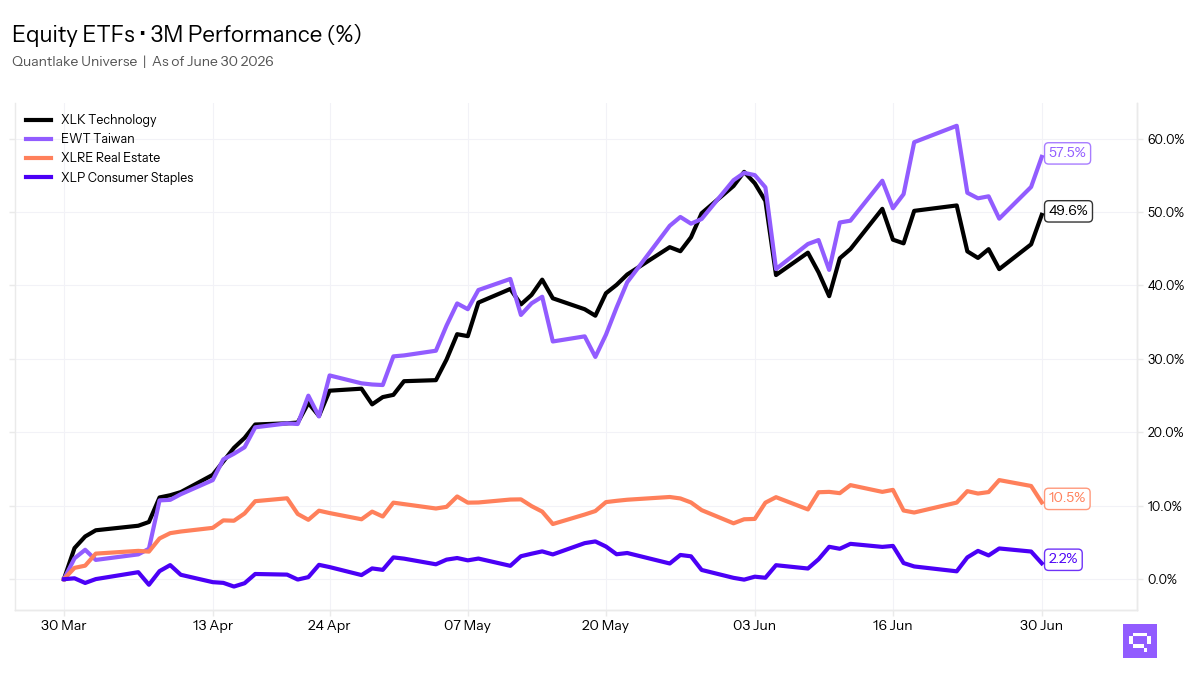
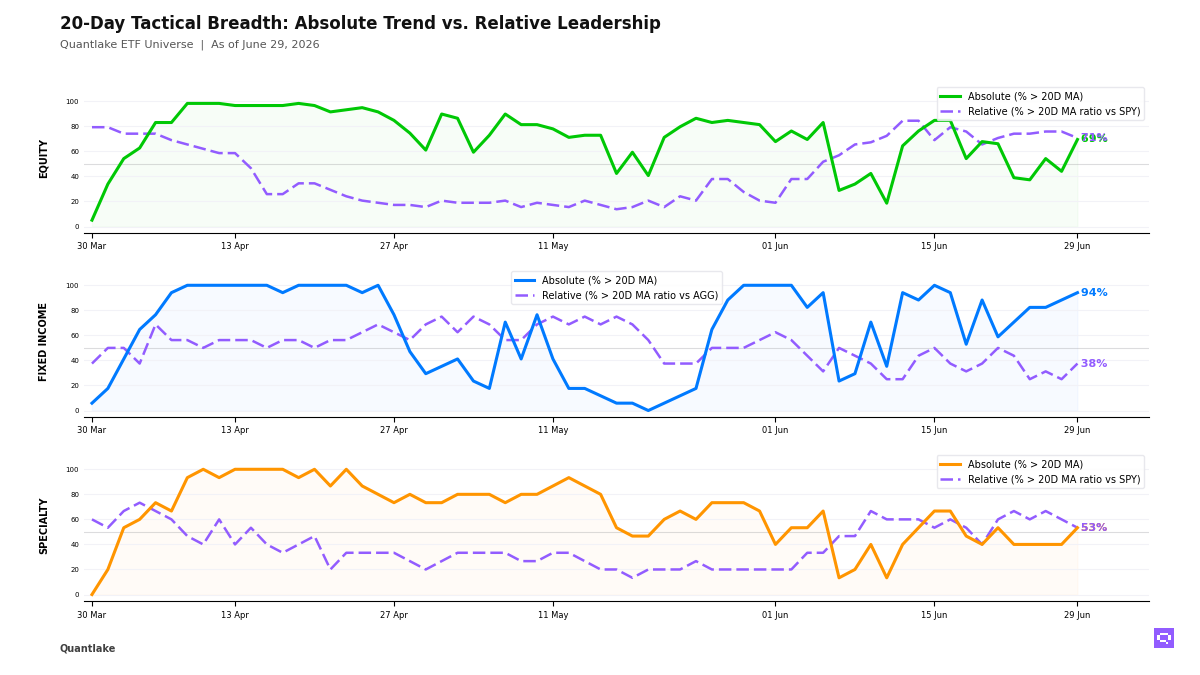
As of June 30, equity price breadth rose to 45 of 59 ETFs (76%, +6.8pp) above their 20-day moving average (20D MA), while 36 of 58 (62%, -8.6pp) held above their 20-day ratio moving average vs S&P 500 SPY (20D ratio MA vs SPY). Technology XLK and Russell Growth IWF crossed above both levels, and the relative leader set concentrated in growth, small caps, emerging markets, Taiwan, South Korea, Brazil, India, and momentum. The equity tape is broad in price and selective in leadership, with growth beta and select international risk exposures defining the current edge.
Fixed income price breadth fell to 14 of 17 ETFs (82%, -11.8pp), and only 7 of 16 outperformed the Aggregate Bonds AGG, a 39pp price-relative gap. Global Bonds BNDX and Int. Treasuries VGIT joined the relative leader set with long-duration Treasuries and munis, while high-yield credit, mortgages, and inflation-linked sectors lost ground. The bond move centers on rate sensitivity and higher-quality sectors, and credit participation is selective.
Specialty relative breadth slipped to 7 of 15 from 8 of 15, with Semiconductors SMH and Biotech IBB beating the S&P 500 SPY while gold, bitcoin proxies, managed futures, and real estate lagged. Commodity alignment sits at 20%, and Agriculture Basket DBA crossed above its 20D MA while broad commodities and silver occupied the laggard side. The specialty and commodity mix favors equity-linked cyclicality over hard-asset leadership.
20-Day Tactical Breadth

Key Takeaways
South Korea EWY, down 6.83% over the period, crossed above its 20-day moving average. EWY also crossed above its 20D ratio MA versus S&P 500 SPY and sits in the daily, weekly, and monthly relative leader cluster with Taiwan equity and US growth. Leadership extends into select Asia and emerging-market equities.
High-yield credit and mortgages sit above their 20D MA and below their 20D ratio MA versus Aggregate Bonds AGG. Global Bonds BNDX and Muni Bonds MUB crossed above their relative averages, and long-duration Treasuries occupy the momentum leader set. Bond leadership tilts toward duration and higher-quality spread sectors.
Real Estate VNQ crossed below its 20D ratio MA versus S&P 500 SPY even though price sits above its 20D MA. Semiconductors SMH, Biotech IBB, and momentum-linked specialty names align across daily, weekly, and monthly windows, while gold, bitcoin proxies, and managed futures occupy the laggard side. Specialty strength concentrates in equity-linked exposures.
FEATURED ETF: iShares MSCI South Korea ETF EWY

Other Technical Signal Events
EQUITY
↗ Price breakouts (cross-up 20D MA)
EWY - iShares MSCI South Korea ETF · 20D perf: -6.83%
IWF - iShares Russell 1000 Growth ETF · -3.49%
SPYG - S&P 500 Growth ETF · -2.82%
XLK - Technology Select Sector · -2.56%
IYW - iShares U.S. Technology ETF · -2.20%
EEM - iShares MSCI Emerging Markets ETF · -1.88%
VWO - Vanguard FTSE Emerging Markets Index ETF · -1.09%
↘ Price breakdowns (cross-down 20D MA)
XLRE - The Real Estate Select Sector · 20D perf: +2.65%
XLP - Consumer Staples Select Sector · +1.98%
VYM - Vanguard High Dividend Yield Index ETF · -0.11%
EFAV - iShares MSCI EAFE Min Vol Factor ETF · -0.78%
↗ Leadership gains (cross-up 20D MA vs SPY)
EWY - iShares MSCI South Korea ETF · 20D relative perf: -5.60%
IWF - iShares Russell 1000 Growth ETF · -2.22%
SPYG - S&P 500 Growth ETF · -1.55%
XLK - Technology Select Sector · -1.28%
IYW - iShares U.S. Technology ETF · -0.91%
EEM - iShares MSCI Emerging Markets ETF · -0.59%
↘ Leadership losses (cross-down 20D MA vs SPY)
XLRE - The Real Estate Select Sector · 20D relative perf: +4.00%
DVY - iShares Select Dividend ETF · +3.84%
XLP - Consumer Staples Select Sector · +3.32%
EWJ - iShares MSCI Japan ETF · +2.24%
SPYV - S&P 500 Value ETF · +1.83%
EWU - iShares MSCI United Kingdom ETF · +1.56%
VYM - Vanguard High Dividend Yield Index ETF · +1.20%
VEA - Vanguard FTSE Developed Markets Index ETF · +0.97%
VLUE - iShares MSCI USA Value Factor ETF · +0.83%
ACWV - iShares MSCI Global Min Vol Factor ETF · +0.57%
EFAV - iShares MSCI EAFE Min Vol Factor ETF · +0.52%
FIXED INCOME
↗ Price breakouts (cross-up 20D MA)
None on the close
↘ Price breakdowns (cross-down 20D MA)
VTIP - Vanguard Short-Term Inflation-Protected Securities Index ETF · 20D perf: -0.42%
TIP - iShares TIPS Bond ETF · -0.50%
↗ Leadership gains (cross-up 20D MA vs AGG)
VGIT - Vanguard Intermediate-Term Treasury Index ETF · 20D relative perf: unch.
MUB - iShares National Muni Bond ETF · +0.33%
BNDX - Vanguard Total International Bond Index ETF · +0.36%
↘ Leadership losses (cross-down 20D MA vs AGG)
MBB - iShares MBS ETF · 20D relative perf: unch.
LQD - iShares iBoxx $ Investment Grade Corporate Bond ETF · -0.18%
SPECIALTY
↗ Price breakouts (cross-up 20D MA)
None on the close
↘ Price breakdowns (cross-down 20D MA)
None on the close
↗ Leadership gains (cross-up 20D MA vs SPY)
None on the close
↘ Leadership losses (cross-down 20D MA vs SPY)
VNQ - Vanguard Real Estate Index ETF · 20D relative perf: +4.75%
COMMODITIES
↗ Price breakouts (cross-up 20D MA)
DBA - Invesco DB Agriculture · 20D perf: -2.09%
↘ Price breakdowns (cross-down 20D MA)
None on the close
↗ Leadership gains (cross-up 20D MA vs SPY)
None on the close
↘ Leadership losses (cross-down 20D MA vs SPY)
None on the close
Romain Gandon
CEO, Quantlake
Disclaimer: This article is for informational and educational purposes only and does not constitute investment advice. Past performance is not indicative of future results.