.png)

Tactical Trends: Small Caps and Overseas Equity Break Below 20D Marks
Price participation holds above 50%, but leadership compresses into defensives.
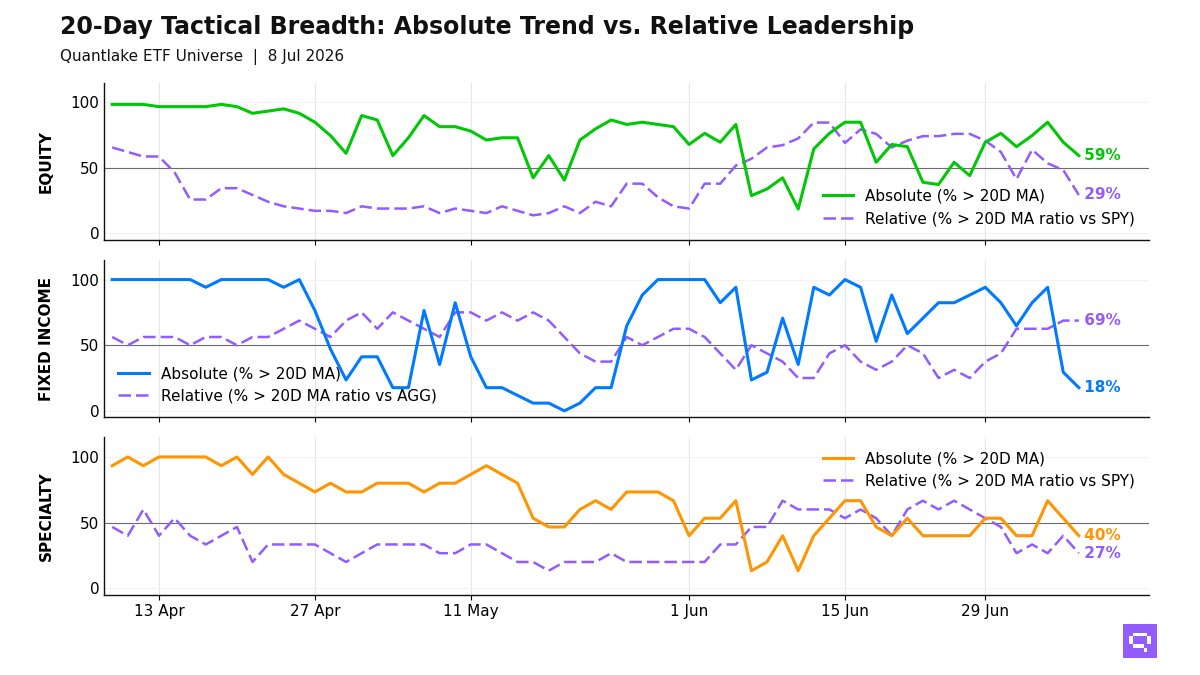
Relative equity leadership thinned at the July 8 close: 35 of 59 equity ETFs (59%, -10.2pp on the day) hold above their 20-day moving average (20D MA), and 17 of 58 (29%, -19.0pp) hold above their 20-day ratio moving average vs the S&P 500 SPY, a 30pp price-relative gap. Low-volatility and dividend-oriented US equity led the relative cluster, Energy XLE crossed above both 20D averages, and small-cap plus overseas equity names such as Germany EWG filled the laggard cluster. The equity configuration resembles price participation without broad relative sponsorship.
Fixed income price participation is limited to high yield and short duration, with 3 of 17 above their 20D MA. Relative results vs the Aggregate Bonds AGG favor EM debt, high yield, and short-duration credit; long Treasuries and preferreds rank at the bottom. Bond leadership concentrates in spread product and shorter duration.
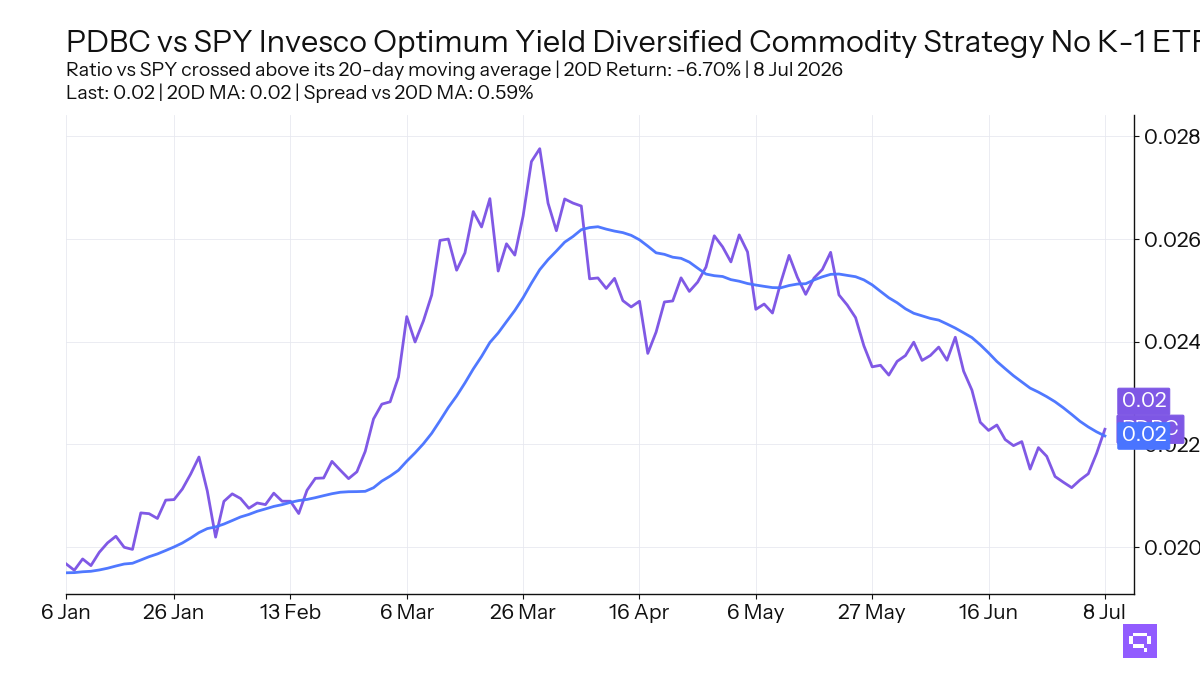
Specialty leadership is narrow, with 6 of 15 above their 20D MA; managed futures and biotech lead vs the S&P 500 SPY, while crypto, gold, and real estate lag. Broad Commodities PDBC crossed above its 20D MA and its 20D ratio MA vs the S&P 500 SPY. Specialty and commodity strength is selective.
20-Day Tactical Breadth
Key Takeaways
China Large Cap FXI, China MCHI, and Energy XLE crossed above their 20D MA and their 20D ratio MA versus the S&P 500 SPY after 20-day returns of down 2.85%, down 1.35%, and down 4.00%. Equity alignment is 54% across daily, weekly, and monthly windows, so the reversal cluster is early and the multi-horizon leader set is small.
EM debt, munis, and short-duration credit beat the Aggregate Bonds AGG even though their prices hold below 20D MA levels. High yield is the only bond theme with both price confirmation and relative leadership, so the fixed income field separates spread resilience from duration pressure.
Managed Futures DBMF crossed above its 20D ratio MA versus the S&P 500 SPY after a 20-day return of down 0.81%. Broad Commodities PDBC, down 5.68% over the trailing 20-day window, crossed above its 20-day moving average. PDBC also crossed above its 20D ratio MA versus the S&P 500 SPY, and commodity alignment is 40% across daily, weekly, and monthly windows.
FEATURED ETF: Invesco Optimum Yield Diversified Commodity Strategy No K-1 ETF PDBC
Other Technical Signal Events
Equity: Price vs 20-day MA
| Signal | Ticker | Name | 20D perf |
|---|---|---|---|
| Cross-up | XLE | Energy Select Sector | -4.00% |
| Cross-up | FXI | iShares China Large-Cap ETF | -2.85% |
| Cross-up | MCHI | iShares MSCI China ETF | -1.35% |
| Cross-up | IWF | iShares Russell 1000 Growth ETF | -0.87% |
| Cross-down | IJR | iShares Core S&P Small-Cap ETF | +4.00% |
| Cross-down | IWM | iShares Russell 2000 ETF | +3.54% |
| Cross-down | INDA | iShares MSCI India ETF | +3.05% |
| Cross-down | VB | Vanguard Small-Cap Index ETF | +2.31% |
| Cross-down | SLYV | SPDR S&P 600 Small Cap Value ETF | +1.54% |
| Cross-down | MDYV | SPDR S&P 400 Mid Cap Value ETF | +1.48% |
| Cross-down | XLRE | The Real Estate Select Sector | +1.15% |
| Cross-down | XLB | Materials Select Sector | +0.78% |
| Cross-down | XLY | Consumer Discretionary Select Sector | +0.12% |
| Cross-down | EWG | iShares MSCI Germany ETF | unch. |
Equity vs SPY: Price Ratio vs 20-day MA
| Signal | Ticker | Name | 20D rel perf |
|---|---|---|---|
| Cross-up | XLE | Energy Select Sector | -5.04% |
| Cross-up | FXI | iShares China Large-Cap ETF | -3.90% |
| Cross-up | MCHI | iShares MSCI China ETF | -2.42% |
| Cross-down | SLYG | SPDR S&P 600 Small Cap Growth ETF | +5.33% |
| Cross-down | XLI | Industrial Select Sector | +3.04% |
| Cross-down | IJR | iShares Core S&P Small-Cap ETF | +2.87% |
| Cross-down | EWZ | iShares MSCI Brazil ETF | +1.99% |
| Cross-down | RSP | Invesco S&P 500 Equal Weight ETF | +1.50% |
| Cross-down | VO | Vanguard Mid-Cap Index ETF | +1.30% |
| Cross-down | XLP | Consumer Staples Select Sector | +1.19% |
| Cross-down | VGK | Vanguard FTSE Europe Index ETF | +1.02% |
| Cross-down | VTI | Vanguard Total Stock Market Index ETF | +0.23% |
| Cross-down | URTH | iShares MSCI World ETF | +0.19% |
| Cross-down | XLRE | The Real Estate Select Sector | unch. |
| Cross-down | XLY | Consumer Discretionary Select Sector | -0.96% |
| Cross-down | EWG | iShares MSCI Germany ETF | -1.09% |
| Cross-down | XLC | Communication Services Select Sector | -2.28% |
Fixed Income: Price vs 20-day MA
| Signal | Ticker | Name | 20D perf |
|---|---|---|---|
| Cross-down | VCSH | Vanguard Short-Term Corporate Bond Index ETF | +0.34% |
| Cross-down | MUB | iShares National Muni Bond ETF | +0.24% |
Specialty: Price vs 20-day MA
| Signal | Ticker | Name | 20D perf |
|---|---|---|---|
| Cross-down | VNQ | Vanguard Real Estate Index ETF | +2.29% |
| Cross-down | IBIT | iShares Bitcoin | -1.84% |
Specialty vs SPY: Price Ratio vs 20-day MA
| Signal | Ticker | Name | 20D rel perf |
|---|---|---|---|
| Cross-up | DBMF | iMGP DBi Managed Futures Strategy ETF | -0.81% |
| Cross-down | REET | iShares Global REIT ETF | +2.54% |
| Cross-down | VNQ | Vanguard Real Estate Index ETF | +1.18% |
| Cross-down | IBIT | iShares Bitcoin | -2.90% |
Commodities: Price vs 20-day MA
| Signal | Ticker | Name | 20D perf |
|---|---|---|---|
| Cross-up | PDBC | Invesco Optimum Yield Diversified Commodity Strategy No K-1 ETF | -5.68% |
Commodities vs SPY: Price Ratio vs 20-day MA
| Signal | Ticker | Name | 20D rel perf |
|---|---|---|---|
| Cross-up | PDBC | Invesco Optimum Yield Diversified Commodity Strategy No K-1 ETF | -6.70% |
Romain Gandon
CEO, Quantlake
Disclaimer: This article is for informational and educational purposes only and does not constitute investment advice. Past performance is not indicative of future results.