.png)

Tactical Trends: Quality and Small Caps Reclaim Price as Growth Lags
Relative strength tilts defensive even as price participation improves.
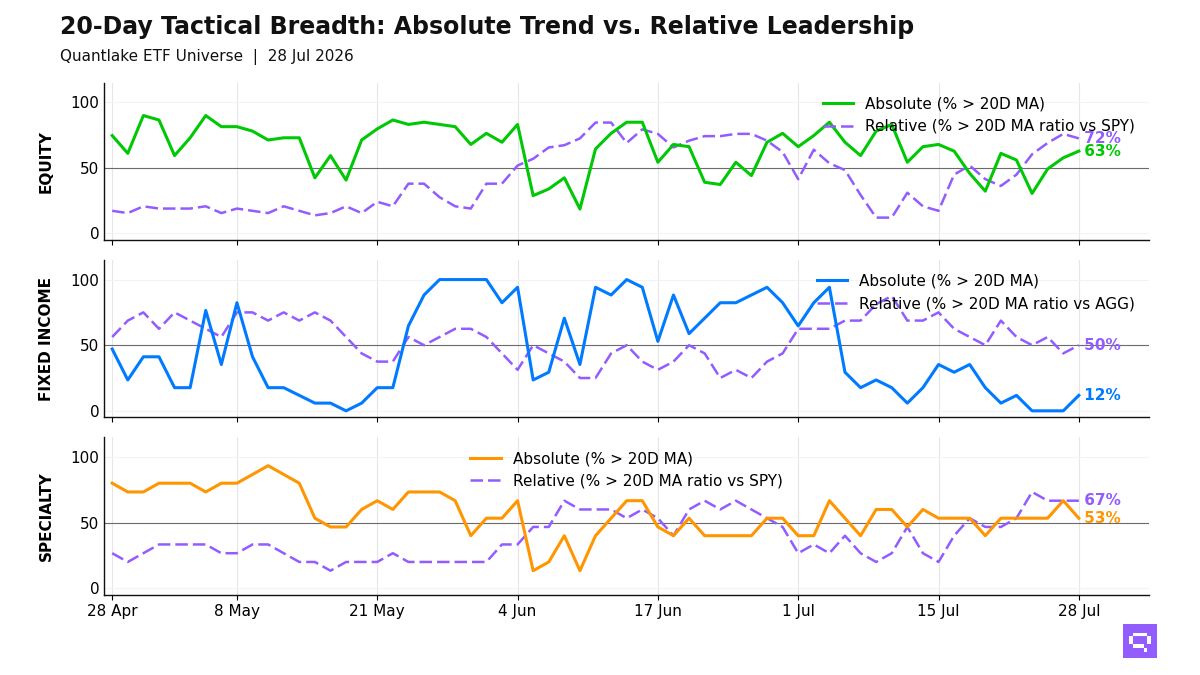
Equity rotation favored quality and smaller size at the July 28 close, with 37 of 59 equity ETFs (63%, +5.1pp on the day) above their 20-day moving average (20D MA) and 42 of 58 (72%, -3.5pp) above their 20-day ratio moving average vs S&P 500 SPY (20D ratio MA vs SPY). Low-volatility, developed ex-US, and dividend-heavy US equity define the leader cluster. US growth, momentum, and Asia-Pacific equity fill the laggard cluster. Dow Jones DIA crossed above its 20D MA, and Developed Markets VEA crossed below its 20D ratio MA vs SPY. Cross-timescale alignment is 61%. The equity configuration concentrates leadership in defensive, value-leaning, and old-economy segments.
Fixed income price participation is limited to Global Bonds BNDX and Mortgage-Backed MBB, with 2 of 17 above their 20D MA. Vs Aggregate Bonds AGG, Treasuries, mortgages, and short duration lead the relative winners. High yield and investment grade fill the laggard cluster. The bond cross-section concentrates in rate sensitivity, with credit risk in the laggard cluster.
Specialty leadership centers on infrastructure, real estate, and low volatility, with 10 of 15 above their 20D ratio MA vs S&P 500 SPY. Biotechnology IBB crossed above that threshold. Gold GLD crossed below its 20D MA and its 20D ratio MA vs SPY. Copper and agriculture define the commodity leaders. Specialty and commodity participation rotates away from precious metals and momentum-linked growth.
20-Day Tactical Breadth
Key Takeaways
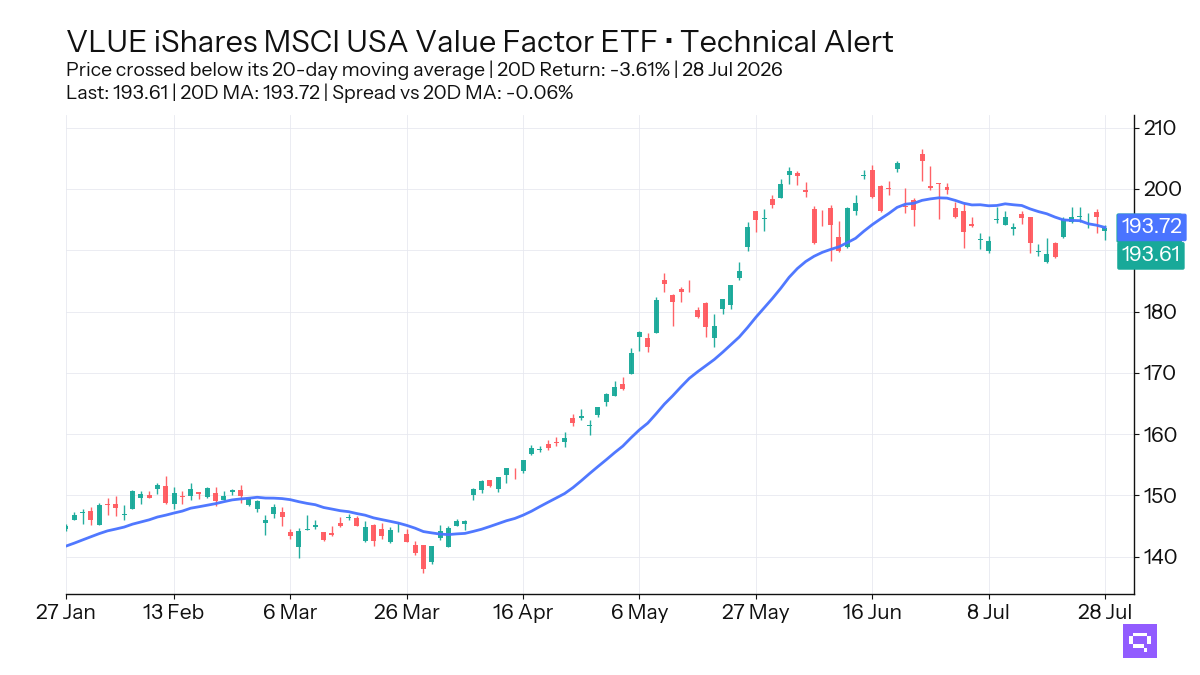
Value Factor VLUE, down 3.61% over the trailing 20-day window, crossed below its 20-day moving average. VLUE also sits in the divergent equity bucket, with price below its 20D MA and relative strength above the S&P 500 SPY. The value cohort splits between weaker price confirmation and firmer benchmark-relative standing.
Small-Cap IJR and Small-Cap VB crossed above their 20D MA, and Communication Services XLC crossed above its 20D ratio MA versus the S&P 500 SPY. S&P MidCap Growth MDYG, Global Equities VT, and Developed Markets VEA crossed below their ratio averages. The equity event set separates smaller-size recovery from growth and broad international lag.
Long Treasuries TLT crossed above its 20D ratio MA versus the Aggregate Bonds AGG even as price holds below the 20D MA, and that same defensive split includes intermediate Treasuries and short duration across fixed income. Gold Miners GDX and Gold GLD crossed below their 20D MA, and Silver SLV crossed below its 20D ratio MA versus the S&P 500 SPY. Cross-asset defense holds its relative edge in bonds, while precious metals lose theirs across specialty and commodity coverage.
FEATURED ETF: iShares MSCI USA Value Factor ETF VLUE
Other Technical Signal Events
Equity: Price vs 20-day MA
| Signal | Ticker | Name | 20D perf |
|---|---|---|---|
| Cross-up | VB | Vanguard Small-Cap Index ETF | -1.11% |
| Cross-up | IJR | iShares Core S&P Small-Cap ETF | -0.71% |
| Cross-up | QUAL | iShares MSCI USA Quality Factor ETF | +0.54% |
| Cross-up | DIA | SPDR Dow Jones Industrial Average ETF | +1.03% |
| Cross-down | VLUE | iShares MSCI USA Value Factor ETF | -3.61% |
Equity vs SPY: Price Ratio vs 20-day MA
| Signal | Ticker | Name | 20D rel perf |
|---|---|---|---|
| Cross-up | XLC | Communication Services Select Sector | +1.68% |
| Cross-down | VT | Vanguard Total World Stock Index ETF | -0.93% |
| Cross-down | VEA | Vanguard FTSE Developed Markets Index ETF | -1.84% |
| Cross-down | MDYG | SPDR S&P 400 Mid Cap Growth ETF | -2.69% |
Fixed Income: Price vs 20-day MA
| Signal | Ticker | Name | 20D perf |
|---|---|---|---|
| Cross-up | MBB | iShares MBS ETF | -1.02% |
| Cross-up | BNDX | Vanguard Total International Bond Index ETF | -0.87% |
Fixed Income vs AGG: Price Ratio vs 20-day MA
| Signal | Ticker | Name | 20D rel perf |
|---|---|---|---|
| Cross-up | TLT | iShares 20+ Year Treasury Bond ETF | -2.21% |
Specialty: Price vs 20-day MA
| Signal | Ticker | Name | 20D perf |
|---|---|---|---|
| Cross-down | GLD | SPDR Gold | +0.21% |
| Cross-down | GDX | VanEck Gold Miners ETF | -1.94% |
Specialty vs SPY: Price Ratio vs 20-day MA
| Signal | Ticker | Name | 20D rel perf |
|---|---|---|---|
| Cross-up | IBB | iShares Biotechnology ETF | +0.40% |
| Cross-down | GLD | SPDR Gold | +0.23% |
Commodities vs SPY: Price Ratio vs 20-day MA
| Signal | Ticker | Name | 20D rel perf |
|---|---|---|---|
| Cross-down | SLV | iShares Silver | -1.84% |
Romain Gandon
CEO, Quantlake
Disclaimer: This article is for informational and educational purposes only and does not constitute investment advice. Past performance is not indicative of future results.