


.png)

Tactical Trends: Low Volatility and Value Cross Back Above 20D MAs
Relative winners outnumber price winners by 20 points in equities.
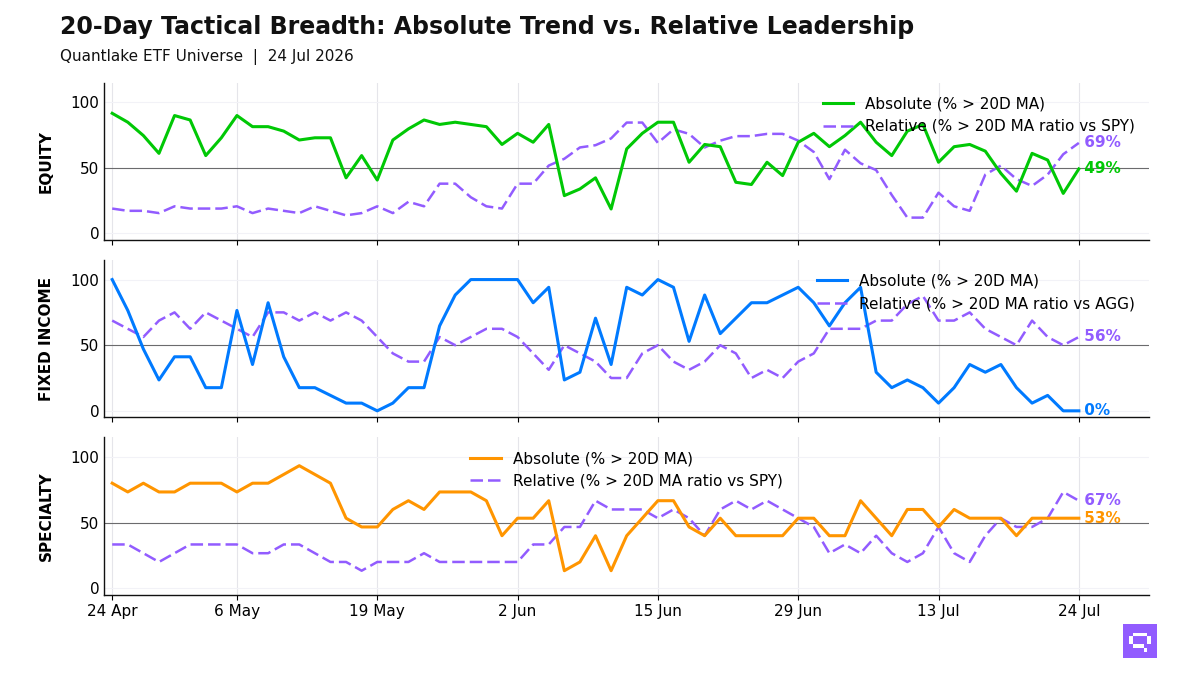
Defensive equity generated five of the 11 price crosses into the July 24 close, led by Global Min Vol ACWV and S&P Value SPYV crossing above their 20-day moving average (20D MA). Equity breadth stands at 29 of 59 ETFs (49%, +18.6pp) above their 20D MA, and 40 of 58 ETFs (69%, +8.6pp) hold above their 20-day ratio moving average versus the S&P 500 SPY (20D ratio MA vs SPY), a 20pp negative price-relative gap. Low-volatility, value, and China fill the price leader cluster. Emerging markets, Asia-Pacific, and US growth lag the benchmark. The equity configuration is defensive because relative leadership exceeds outright price participation.
Fixed income has no price confirmation, with 0 of 17 ETFs above their 20D MA. Short duration, mortgages, and high yield outperform the Aggregate Bonds AGG. Long-duration Treasuries and investment grade credit lag. The bond cross-section favors lower rate sensitivity over duration risk.
Specialty holds 10 of 15 ETFs above their 20D ratio MA versus the S&P 500 SPY, with managed futures, real estate, and gold-linked exposures leading and Biotechnology IBB crossing below its ratio MA. Commodities add aligned strength in oil, broad commodities, agriculture, and copper, and Silver SLV crossed above its 20D ratio MA versus SPY. The non-core bucket favors real assets and alternative beta over growth-sensitive themes.
20-Day Tactical Breadth
Key Takeaways
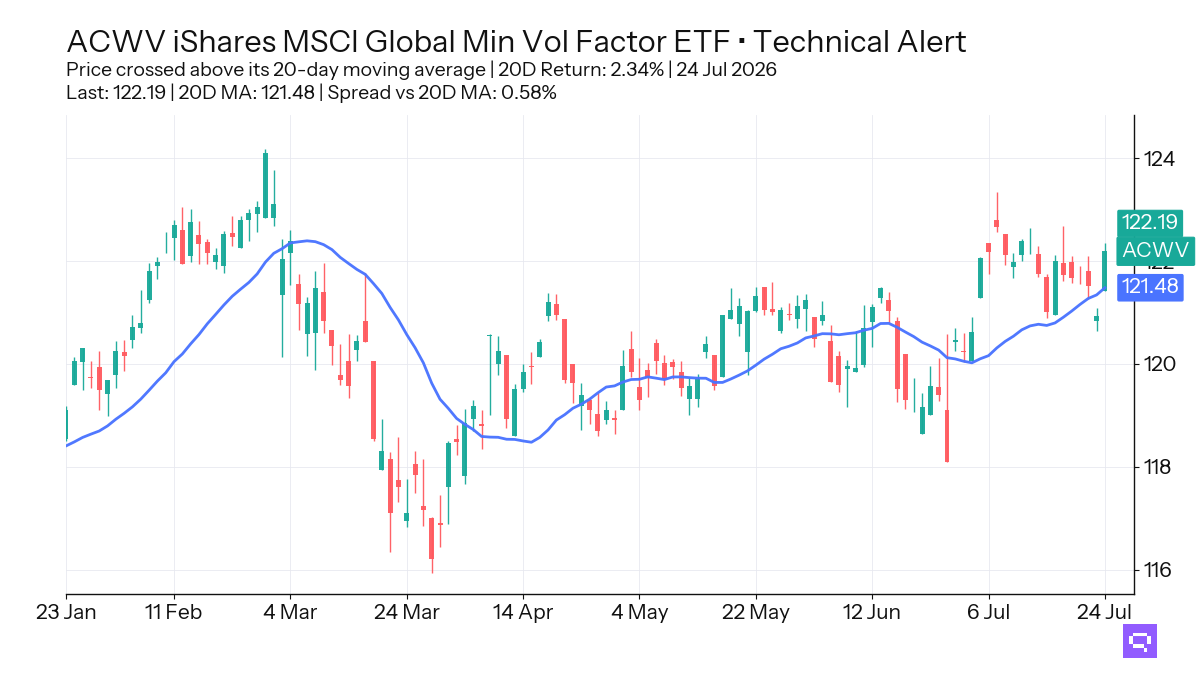
Global Minimum Volatility ACWV, up 2.34% over the trailing 20-day window, crossed above its 20-day moving average. ACWV also sits in the daily, weekly, and monthly absolute leader cluster, so the fresh price confirmation aligns with the broader low-volatility leadership.
Dow Jones DIA, down 0.69% over the trailing 20-day window, and Germany EWG, down 0.51% over the trailing 20-day window, crossed above their 20D ratio MA versus the S&P 500 SPY. Small-cap, materials, and staples ratios showed the same negative-lookback pattern, with 20-day relative losses ranging from 0.40% to 1.76%; the relative turn marks stabilization rather than established leadership.
Mortgage-Backed MBB, down 0.08% over the trailing 20-day window, crossed above its 20D ratio MA versus the Aggregate Bonds AGG. High yield, short duration, and mortgages fill the fixed-income relative leader cluster, while long duration and investment grade lag; bond outperformance concentrates away from rate sensitivity.
FEATURED ETF: iShares MSCI Global Min Vol Factor ETF ACWV
Other Technical Signal Events
Equity: Price vs 20-day MA
| Signal | Ticker | Name | 20D perf |
|---|---|---|---|
| Cross-up | XLB | Materials Select Sector | -1.12% |
| Cross-up | SLYV | SPDR S&P 600 Small Cap Value ETF | +0.18% |
| Cross-up | VO | Vanguard Mid-Cap Index ETF | +0.24% |
| Cross-up | MDYV | SPDR S&P 400 Mid Cap Value ETF | +0.74% |
| Cross-up | RSP | Invesco S&P 500 Equal Weight ETF | +0.86% |
| Cross-up | IQLT | iShares MSCI Intl Quality Factor ETF | +1.00% |
| Cross-up | IVLU | iShares Edge MSCI Intl Value Factor ETF | +1.41% |
| Cross-up | VIG | Vanguard Dividend Appreciation Index ETF | +1.91% |
| Cross-up | JEPI | JPMorgan Equity Premium Income ETF | +2.00% |
| Cross-up | SPYV | S&P 500 Value ETF | +2.30% |
| Cross-up | ACWV | iShares MSCI Global Min Vol Factor ETF | +2.34% |
Equity vs SPY: Price Ratio vs 20-day MA
| Signal | Ticker | Name | 20D rel perf |
|---|---|---|---|
| Cross-up | VB | Vanguard Small-Cap Index ETF | -1.76% |
| Cross-up | XLB | Materials Select Sector | -1.74% |
| Cross-up | DIA | SPDR Dow Jones Industrial Average ETF | -0.69% |
| Cross-up | EWG | iShares MSCI Germany ETF | -0.51% |
| Cross-up | XLP | Consumer Staples Select Sector | -0.40% |
Fixed Income vs AGG: Price Ratio vs 20-day MA
| Signal | Ticker | Name | 20D rel perf |
|---|---|---|---|
| Cross-up | MBB | iShares MBS ETF | unch. |
Specialty vs SPY: Price Ratio vs 20-day MA
| Signal | Ticker | Name | 20D rel perf |
|---|---|---|---|
| Cross-down | IBB | iShares Biotechnology ETF | +1.79% |
Commodities vs SPY: Price Ratio vs 20-day MA
| Signal | Ticker | Name | 20D rel perf |
|---|---|---|---|
| Cross-up | SLV | iShares Silver | -0.19% |
Romain Gandon
CEO, Quantlake
Disclaimer: This article is for informational and educational purposes only and does not constitute investment advice. Past performance is not indicative of future results.


