


.png)

Tactical Trends: Large-Cap Growth Loses 20D Support as Value Leads
Low-volatility and non-US equity absorb leadership at the close
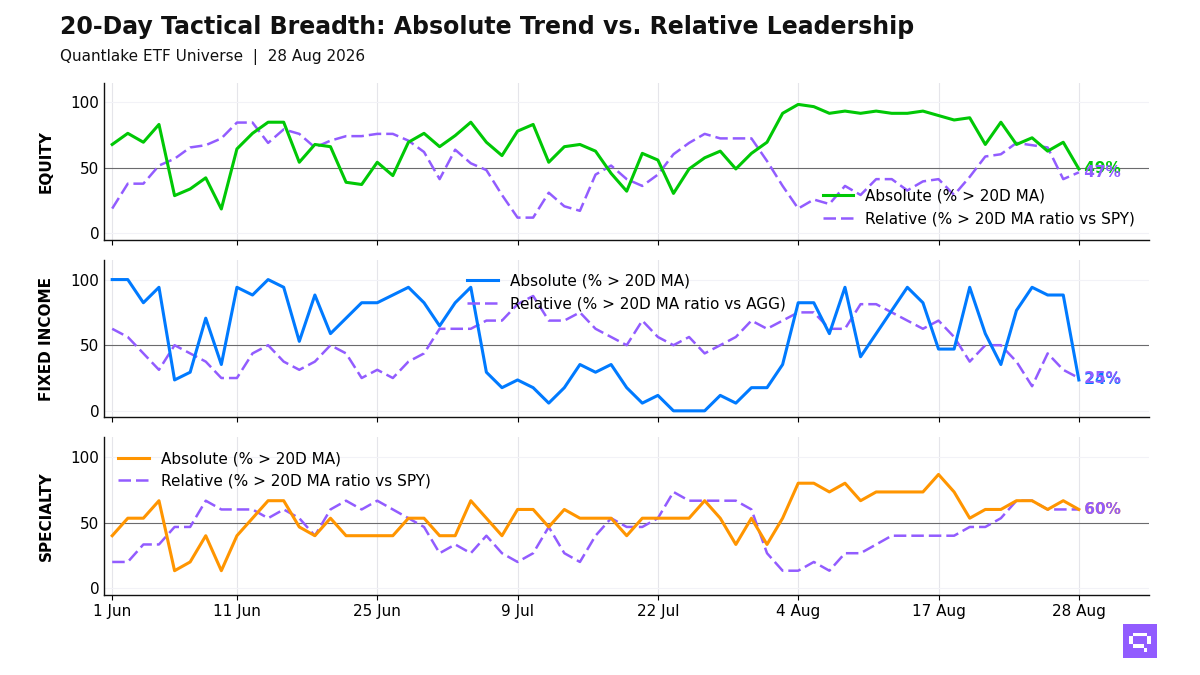
US growth and broad beta broke below their 20-day moving averages at the August 28 close. Equity breadth sits at 29 of 59 ETFs (49%, -20.3pp) above their 20D MA, and relative breadth sits at 27 of 58 (47%, +5.2pp) above their 20-day ratio moving average versus the S&P 500 SPY (20D ratio MA vs SPY); the price-relative gap narrowed from 28pp to 3pp. Low-volatility, value, and select Asia-Pacific exposure lead both measures. US growth, equal weight, and China lag. The equity read is a cross-sectional rotation away from US beta.
Fixed income leadership is limited to 4 of 17 ETFs in high-yield credit, investment grade, and long duration. Intermediate duration, EM debt, and rate-sensitive spread sectors lag the Aggregate Bonds AGG. Bond participation is barbelled between credit and the long end, with the belly and short-duration segments lagging.
Specialty leadership concentrates in precious metals, crypto proxies, and other diversifiers, with 9 of 15 ETFs above their 20D MA and ahead of the S&P 500 SPY. Semiconductors, clean energy, and real estate lag. Commodity strength concentrates in oil, agriculture, and broad commodity exposure, while copper trails. The specialty and commodity mix favors diversifiers and resource exposure over cyclical growth themes.
20-Day Tactical Breadth
Key Takeaways
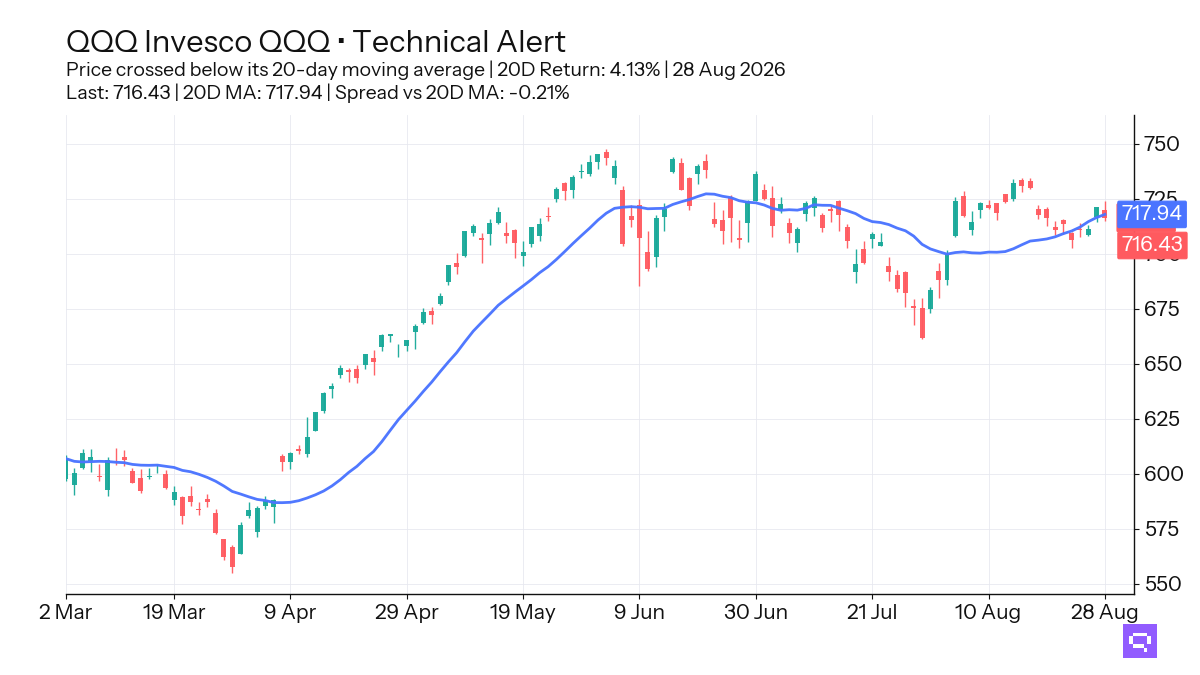
Nasdaq 100 QQQ, up 4.13% over the trailing 20-day window, crossed below its 20-day moving average. QQQ also crossed below its 20D ratio MA versus the S&P 500 SPY after a 1.11% 20-day relative gain. The break pairs weaker price with fading relative leadership.
Communication Services XLC crossed above its 20D ratio MA versus the S&P 500 SPY with a 1.36% 20-day relative gain. Japan EWJ crossed above its 20D ratio MA versus SPY with a 0.76% relative gain. Cross-timescale leaders cluster in Taiwan EWT, Intl Value IVLU, and Financials XLF, while growth, momentum, and India fill the laggard set. Leadership quality tilts toward value and non-US equity.
Mortgage-Backed MBB crossed below its 20D ratio MA versus the Aggregate Bonds AGG after a 0.17% 20-day relative gain. 7-10yr Treasuries IEF and 3-7yr Treasuries IEI crossed below their 20D MA. Bond leaders across timescales are confined to high-yield credit. Bond participation is selective, with little confirmation outside credit and one long-duration exception.
FEATURED ETF: Invesco QQQ QQQ
Other Technical Signal Events
Equity: Price vs 20-day MA
| Signal | Ticker | Name | 20D perf |
|---|---|---|---|
| Cross-down | QQQ | Invesco QQQ | +4.13% |
| Cross-down | IWF | iShares Russell 1000 Growth ETF | +3.74% |
| Cross-down | SPYG | S&P 500 Growth ETF | +3.51% |
| Cross-down | VTI | Vanguard Total Stock Market Index ETF | +3.03% |
| Cross-down | RSP | Invesco S&P 500 Equal Weight ETF | +2.64% |
| Cross-down | IMTM | iShares MSCI Intl Momentum Factor ETF | +2.22% |
| Cross-down | DIA | SPDR Dow Jones Industrial Average ETF | +2.13% |
| Cross-down | EFA | iShares MSCI EAFE ETF | +2.03% |
| Cross-down | QUAL | iShares MSCI USA Quality Factor ETF | +1.96% |
| Cross-down | VO | Vanguard Mid-Cap Index ETF | +1.91% |
| Cross-down | VGK | Vanguard FTSE Europe Index ETF | +1.53% |
| Cross-down | JEPI | JPMorgan Equity Premium Income ETF | +1.27% |
Equity vs SPY: Price Ratio vs 20-day MA
| Signal | Ticker | Name | 20D rel perf |
|---|---|---|---|
| Cross-up | EWU | iShares MSCI United Kingdom ETF | -2.62% |
| Cross-up | DVY | iShares Select Dividend ETF | -1.34% |
| Cross-up | IVLU | iShares Edge MSCI Intl Value Factor ETF | -1.34% |
| Cross-up | XLF | Financial Select Sector | -0.92% |
| Cross-up | SPYV | S&P 500 Value ETF | -0.57% |
| Cross-up | EWJ | iShares MSCI Japan ETF | +0.76% |
| Cross-up | XLC | Communication Services Select Sector | +1.36% |
| Cross-down | QQQ | Invesco QQQ | +1.11% |
| Cross-down | IWF | iShares Russell 1000 Growth ETF | +0.73% |
| Cross-down | SPYG | S&P 500 Growth ETF | +0.51% |
| Cross-down | RSP | Invesco S&P 500 Equal Weight ETF | -0.34% |
Fixed Income: Price vs 20-day MA
| Signal | Ticker | Name | 20D perf |
|---|---|---|---|
| Cross-down | PFF | iShares Preferred and Income Securities ETF | +0.70% |
| Cross-down | EMB | iShares J.P. Morgan USD Emerging Markets Bond ETF | +0.68% |
| Cross-down | MBB | iShares MBS ETF | +0.64% |
| Cross-down | VCIT | Vanguard Intermediate-Term Corporate Bond Index ETF | +0.29% |
| Cross-down | VCSH | Vanguard Short-Term Corporate Bond Index ETF | +0.24% |
| Cross-down | IEF | iShares 7-10 Year Treasury Bond ETF | +0.23% |
| Cross-down | VGIT | Vanguard Intermediate-Term Treasury Index ETF | +0.15% |
| Cross-down | TIP | iShares TIPS Bond ETF | unch. |
| Cross-down | IEI | iShares 3-7 Year Treasury Bond ETF | unch. |
| Cross-down | VTIP | Vanguard Short-Term Inflation-Protected Securities Index ETF | unch. |
Fixed Income vs AGG: Price Ratio vs 20-day MA
| Signal | Ticker | Name | 20D rel perf |
|---|---|---|---|
| Cross-down | MBB | iShares MBS ETF | +0.17% |
Specialty: Price vs 20-day MA
| Signal | Ticker | Name | 20D perf |
|---|---|---|---|
| Cross-down | SMH | VanEck Semiconductor ETF | +2.33% |
Specialty vs SPY: Price Ratio vs 20-day MA
| Signal | Ticker | Name | 20D rel perf |
|---|---|---|---|
| Cross-up | DBMF | iMGP DBi Managed Futures Strategy ETF | -1.36% |
| Cross-down | SMH | VanEck Semiconductor ETF | -0.64% |
Romain Gandon
CEO, Quantlake
Disclaimer: This article is for informational and educational purposes only and does not constitute investment advice. Past performance is not indicative of future results.


