.png)

Tactical Trends: International Equity Leads as US Beta Loses Ground
High participation now leans on ex-US and low-volatility leaders
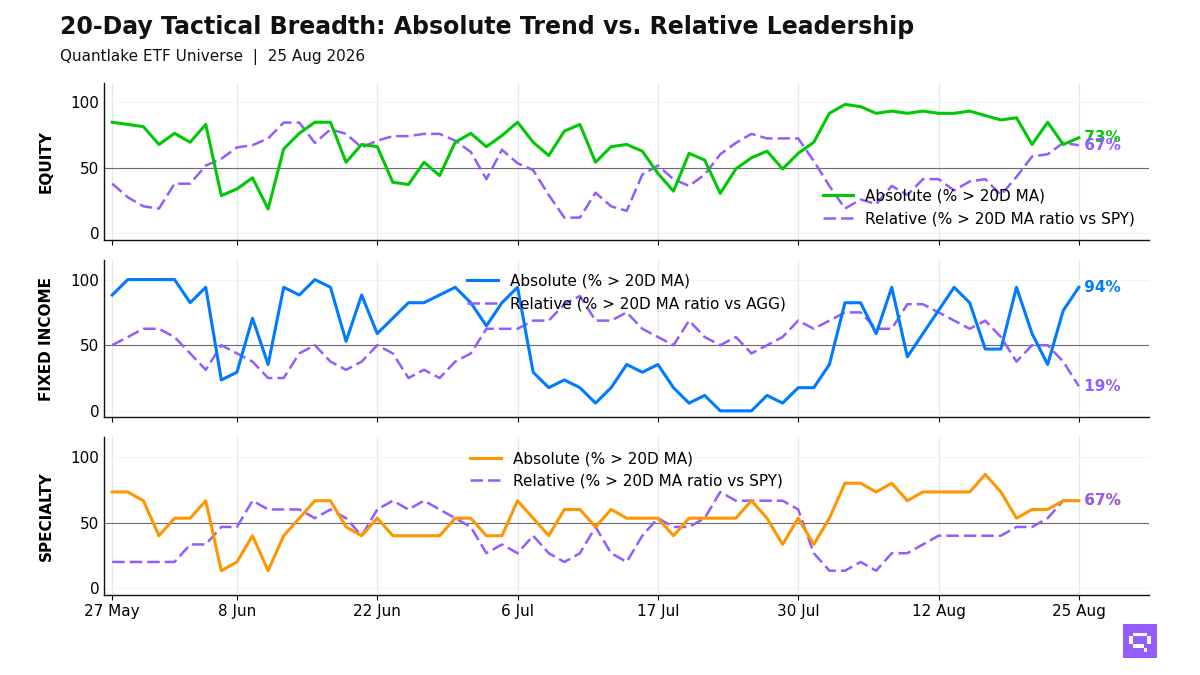
International equity leadership defines the ETF universe at the close on August 25, with developed ex-US equities, emerging markets, and low-volatility factors at the front. In equity, 43 of 59 ETFs (73%, +5.1pp on the day) hold above their 20-day moving average (20D MA), and 39 of 58 ETFs (67%, -1.7pp) hold above their 20-day ratio moving average vs S&P 500 SPY (20D ratio MA vs SPY). China and five US growth and size exposures fill the relative laggard cluster, so the equity regime is broad bull with leadership tilted away from US beta.
Fixed income participation is widespread, with 16 of 17 ETFs above their 20D MA, and only Investment Grade Credit LQD, Mortgage-Backed Securities MBB, and long-duration TLT outperform the Aggregate Bonds AGG. Global Bonds BNDX, Preferred Stock PFF, and Corporate Credit VCIT crossed above their 20D MAs. High Yield HYG and TIPS TIP crossed below their 20D ratio MAs vs AGG. Bond leadership concentrates in rate-sensitive duration and select investment-grade credit.
Specialty leadership clusters in gold-linked exposures, biotech, and defensive equity overlays. Global REITs REET, down 5.45% over the trailing 20-day window, crossed above its 20D MA and its 20D ratio MA vs S&P 500 SPY. Oil USO, up 4.70% over the trailing 20-day window, crossed below its 20D MA and its 20D ratio MA vs S&P 500 SPY. Hard-asset leadership is selective, with precious metals firm and oil fading.
20-Day Tactical Breadth
Key Takeaways
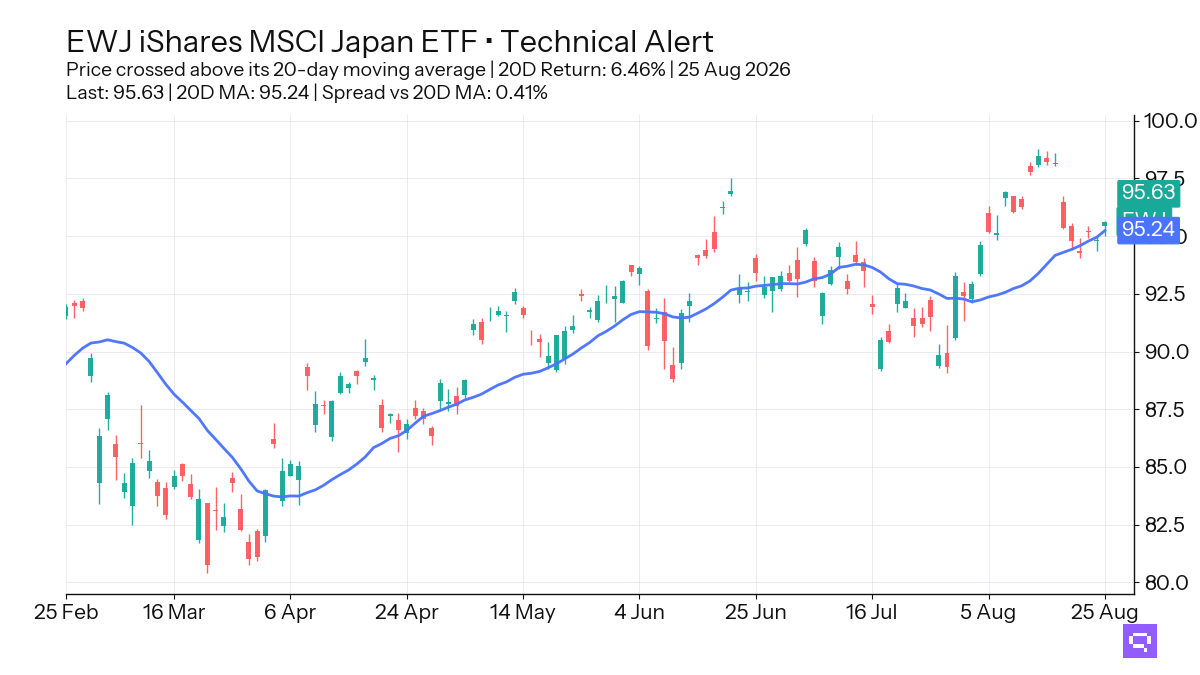
Japan EWJ, up 6.46% over the trailing 20-day window, crossed above its 20-day moving average. EWJ also crossed above its 20D ratio MA vs S&P 500 SPY, and equity cross-timescale alignment is 71%, which suggests the international leadership cluster extends beyond a one-day price move.
Russell 2000 IWM crossed above its 20D MA, while Mid-Cap VO and US Broad Market VTI crossed below their 20D ratio MAs vs S&P 500 SPY. IWM joins the divergent bucket with price above its 20D MA and relative lag vs the benchmark, so US size recovery lacks benchmark-relative confirmation.
Investment Grade Credit LQD crossed above its 20D ratio MA vs Aggregate Bonds AGG. Managed Futures DBMF crossed below its 20D MA and its 20D ratio MA vs S&P 500 SPY, and Oil USO crossed below its 20D MA and its 20D ratio MA vs S&P 500 SPY. Credit quality outperforms, alternative hedges weaken, and commodity strength narrows to metals.
FEATURED ETF: iShares MSCI Japan ETF EWJ
Other Technical Signal Events
Equity: Price vs 20-day MA
| Signal | Ticker | Name | 20D perf |
|---|---|---|---|
| Cross-up | INDA | iShares MSCI India ETF | +1.72% |
| Cross-up | IWM | iShares Russell 2000 ETF | +2.00% |
| Cross-up | EWJ | iShares MSCI Japan ETF | +6.46% |
| Cross-down | VYM | Vanguard High Dividend Yield Index ETF | +0.61% |
Equity vs SPY: Price Ratio vs 20-day MA
| Signal | Ticker | Name | 20D rel perf |
|---|---|---|---|
| Cross-up | INDA | iShares MSCI India ETF | -1.61% |
| Cross-up | EWJ | iShares MSCI Japan ETF | +2.97% |
| Cross-down | VTI | Vanguard Total Stock Market Index ETF | unch. |
| Cross-down | VO | Vanguard Mid-Cap Index ETF | -1.56% |
| Cross-down | VYM | Vanguard High Dividend Yield Index ETF | -2.68% |
Fixed Income: Price vs 20-day MA
| Signal | Ticker | Name | 20D perf |
|---|---|---|---|
| Cross-up | BNDX | Vanguard Total International Bond Index ETF | unch. |
| Cross-up | VCIT | Vanguard Intermediate-Term Corporate Bond Index ETF | +0.51% |
| Cross-up | PFF | iShares Preferred and Income Securities ETF | +1.53% |
Fixed Income vs AGG: Price Ratio vs 20-day MA
| Signal | Ticker | Name | 20D rel perf |
|---|---|---|---|
| Cross-up | LQD | iShares iBoxx $ Investment Grade Corporate Bond ETF | unch. |
| Cross-down | JNK | SPDR Bloomberg High Yield Bond ETF | +0.73% |
| Cross-down | HYG | iShares iBoxx $ High Yield Corporate Bond ETF | +0.68% |
| Cross-down | TIP | iShares TIPS Bond ETF | +0.27% |
| Cross-down | VTIP | Vanguard Short-Term Inflation-Protected Securities Index ETF | unch. |
Specialty: Price vs 20-day MA
| Signal | Ticker | Name | 20D perf |
|---|---|---|---|
| Cross-up | REET | iShares Global REIT ETF | -2.25% |
| Cross-down | DBMF | iMGP DBi Managed Futures Strategy ETF | unch. |
Specialty vs SPY: Price Ratio vs 20-day MA
| Signal | Ticker | Name | 20D rel perf |
|---|---|---|---|
| Cross-up | REET | iShares Global REIT ETF | -5.45% |
| Cross-down | DBMF | iMGP DBi Managed Futures Strategy ETF | -3.36% |
Commodities: Price vs 20-day MA
| Signal | Ticker | Name | 20D perf |
|---|---|---|---|
| Cross-down | USO | United States Oil Fund LP | +4.70% |
Commodities vs SPY: Price Ratio vs 20-day MA
| Signal | Ticker | Name | 20D rel perf |
|---|---|---|---|
| Cross-down | USO | United States Oil Fund LP | +1.27% |
Romain Gandon
CEO, Quantlake
Disclaimer: This article is for informational and educational purposes only and does not constitute investment advice. Past performance is not indicative of future results.