.png)

Tactical Trends: International Equities Reclaim Ground at the 20D MA
Price participation outruns benchmark-relative confirmation
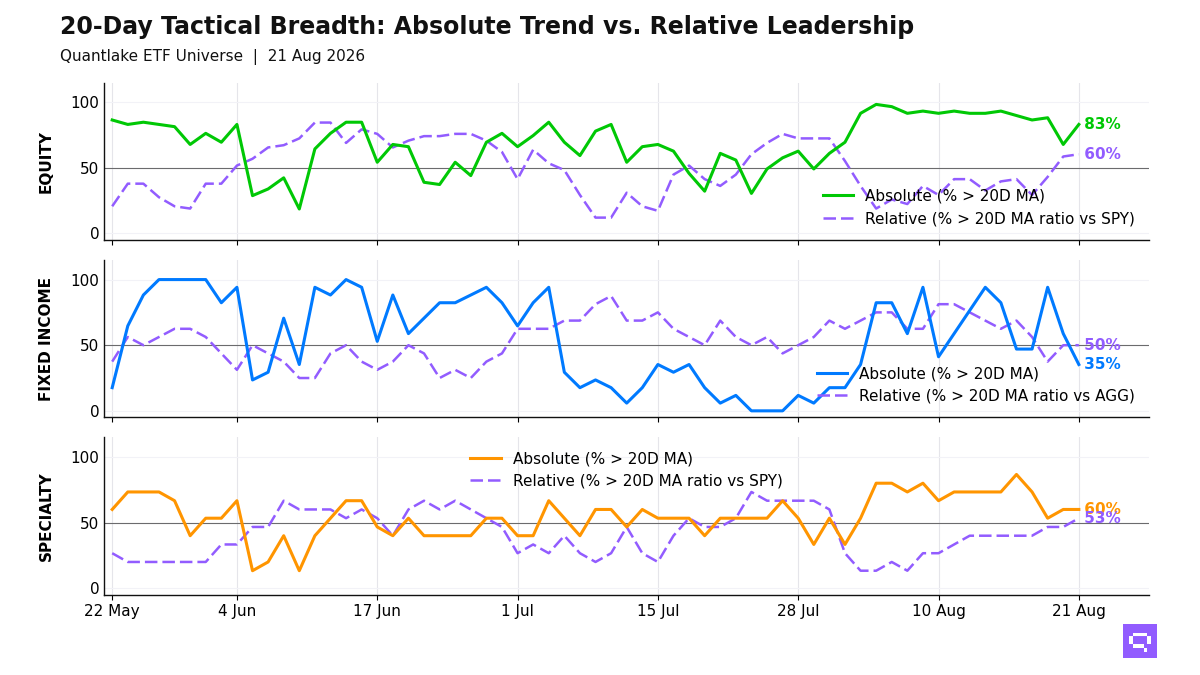
Ex-US and defensive equities define the rebound at the close on August 21, with 49 of 59 equity ETFs (83%, +15.2pp on the day) above their 20-day moving average (20D MA) and 35 of 58 (60%, +1.7pp) above their 20-day ratio moving average vs S&P 500 SPY (20D ratio MA vs SPY). Developed ex-US, emerging markets, and low-volatility factors fill the leader cluster. Financials and industrials lag. Japan and China populate the price-above, benchmark-lagging bucket. The equity regime is broad, and the 23pp price-relative gap shows price participation outruns benchmark-relative confirmation.
Fixed income leadership is limited to high-yield credit, short duration, and inflation-linked bonds, with 6 of 17 above their 20D MA and 8 of 16 above their 20D ratio MA vs Aggregate Bonds AGG. 3-7yr Treasuries IEI and Int. Treasuries VGIT beat the benchmark from below their 20D MA. Investment grade and long duration fill the laggard cluster. Bond participation concentrates in credit and front-end stability.
Specialty leadership is concentrated in gold, bitcoin proxies, and biotech, with 8 of 15 above their 20D ratio MA vs S&P 500 SPY. Clean energy, real estate, and semiconductors fill the laggard cluster. Copper CPER crossed above its 20D MA and its 20D ratio MA vs SPY, and Managed Futures DBMF crossed above its 20D ratio MA vs SPY. Specialty and commodities leadership concentrates in diversifiers and metals.
20-Day Tactical Breadth
Key Takeaways
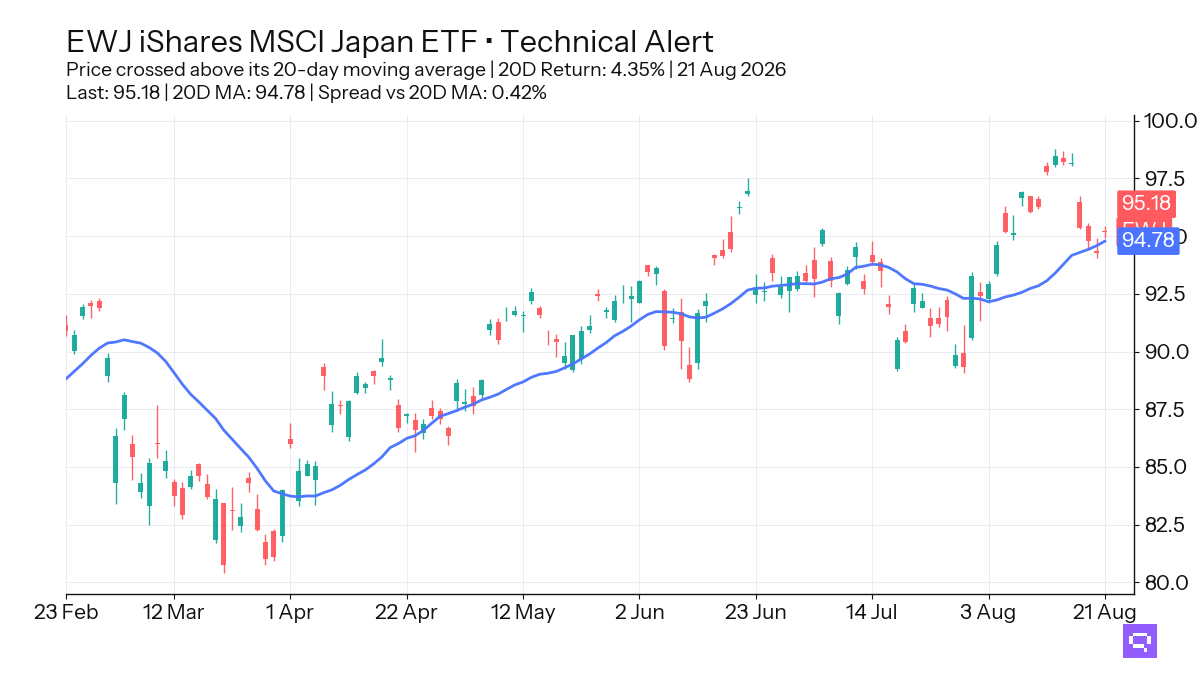
Japan EWJ, up 4.35% over the trailing 20-day window, crossed above its 20-day moving average. EWJ sits in the equity bucket's price-above, benchmark-lagging cluster, so the signal marks price recovery ahead of relative leadership versus S&P 500 SPY.
Russell 2000 IWM, down 0.59% over the trailing 20-day window versus S&P 500 SPY, crossed above its 20D ratio MA versus SPY, and Small-Cap VB plus Mid-Cap VO did the same from relative returns of down 0.41% and down 0.60%. Size leadership is early, with three ratio crosses following negative 20-day relative returns.
7-10yr Treasuries IEF, 3-7yr Treasuries IEI, and Int. Treasuries VGIT crossed below their 20D MA, even though IEI and VGIT hold above their 20D ratio MA versus Aggregate Bonds AGG. Treasury duration lost price confirmation, and the relative edge is limited to two intermediate Treasury proxies.
FEATURED ETF: iShares MSCI Japan ETF EWJ
Other Technical Signal Events
Equity: Price vs 20-day MA
| Signal | Ticker | Name | 20D perf |
|---|---|---|---|
| Cross-up | XLRE | The Real Estate Select Sector | -1.89% |
| Cross-up | VYM | Vanguard High Dividend Yield Index ETF | +1.69% |
| Cross-up | SLYV | SPDR S&P 600 Small Cap Value ETF | +1.87% |
| Cross-up | VIG | Vanguard Dividend Appreciation Index ETF | +2.20% |
| Cross-up | XLP | Consumer Staples Select Sector | +2.21% |
| Cross-up | QUAL | iShares MSCI USA Quality Factor ETF | +2.96% |
| Cross-up | IWM | iShares Russell 2000 ETF | +3.02% |
| Cross-up | FXI | iShares China Large-Cap ETF | +3.70% |
| Cross-up | EWJ | iShares MSCI Japan ETF | +4.35% |
Equity vs SPY: Price Ratio vs 20-day MA
| Signal | Ticker | Name | 20D rel perf |
|---|---|---|---|
| Cross-up | XLP | Consumer Staples Select Sector | -1.37% |
| Cross-up | VO | Vanguard Mid-Cap Index ETF | -0.60% |
| Cross-up | IWM | iShares Russell 2000 ETF | -0.59% |
| Cross-up | VB | Vanguard Small-Cap Index ETF | -0.41% |
| Cross-up | VTI | Vanguard Total Stock Market Index ETF | unch. |
| Cross-down | IYW | iShares U.S. Technology ETF | +1.07% |
| Cross-down | MCHI | iShares MSCI China ETF | +0.72% |
| Cross-down | XLK | Technology Select Sector | +0.58% |
| Cross-down | DVY | iShares Select Dividend ETF | -2.85% |
Fixed Income: Price vs 20-day MA
| Signal | Ticker | Name | 20D perf |
|---|---|---|---|
| Cross-down | IEI | iShares 3-7 Year Treasury Bond ETF | +0.40% |
| Cross-down | VGIT | Vanguard Intermediate-Term Treasury Index ETF | +0.33% |
| Cross-down | IEF | iShares 7-10 Year Treasury Bond ETF | +0.12% |
Specialty vs SPY: Price Ratio vs 20-day MA
| Signal | Ticker | Name | 20D rel perf |
|---|---|---|---|
| Cross-up | DBMF | iMGP DBi Managed Futures Strategy ETF | -3.62% |
Commodities: Price vs 20-day MA
| Signal | Ticker | Name | 20D perf |
|---|---|---|---|
| Cross-up | CPER | United States Copper LP | +4.28% |
Commodities vs SPY: Price Ratio vs 20-day MA
| Signal | Ticker | Name | 20D rel perf |
|---|---|---|---|
| Cross-up | CPER | United States Copper LP | +0.63% |
Romain Gandon
CEO, Quantlake
Disclaimer: This article is for informational and educational purposes only and does not constitute investment advice. Past performance is not indicative of future results.