.png)

Tactical Trends: International and Defensive Equities Slip Behind SPY
A 59pp equity gap separates price participation from relative leadership.
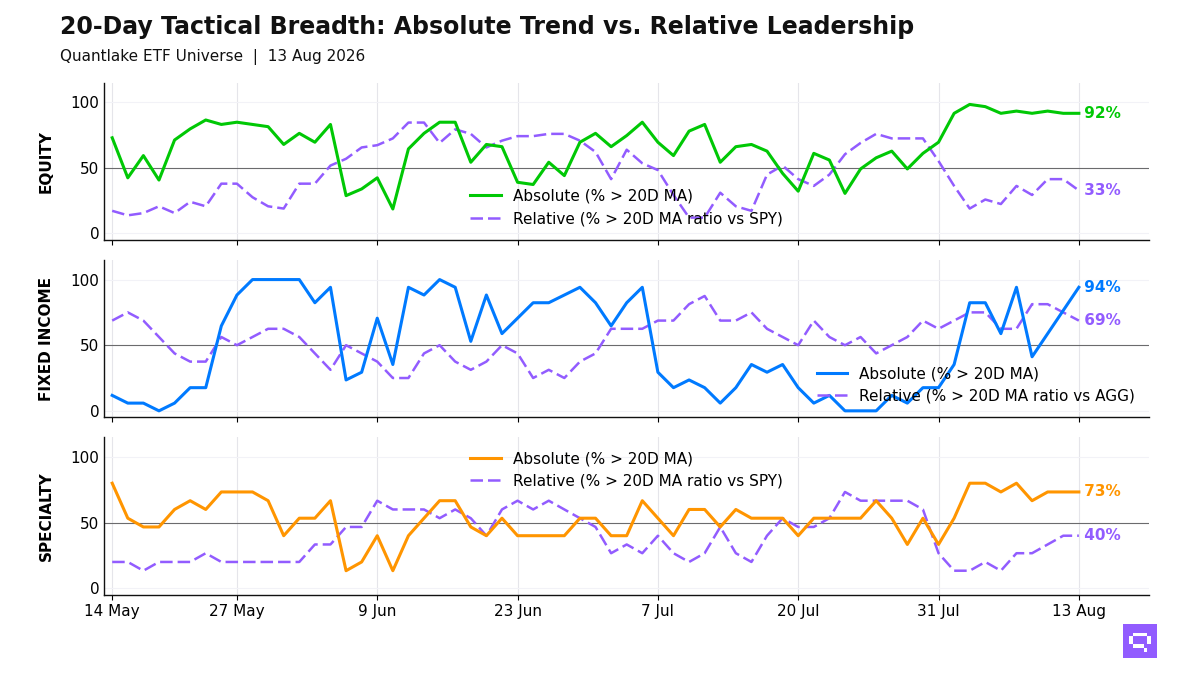
Relative equity leadership narrowed at the August 13 close. Fifty-four of 59 ETFs (92%, unchanged on the day) sit above their 20-day moving average 20D MA, and only 19 of 58 (33%, -8.6pp) sit above their 20-day ratio moving average versus the S&P 500 SPY, 20D ratio MA vs SPY. Asia-Pacific equity and US growth hold the relative leader cluster. Low-volatility, developed ex-US, and small-cap exposures fill the laggard side. The +59pp price-relative gap matches a benchmark-led advance. Price participation is broad, and leadership concentrates in a smaller subset.
Fixed income breadth is broad, with 11 of 16 ETFs (69%) outperforming the Aggregate Bonds AGG. EM debt, high-yield credit, and intermediate Treasuries lead. The long end and parts of the inflation-linked group lag. The long end is the lone price laggard, so the bond profile concentrates in credit and intermediate rate exposure.
Specialty leadership is limited to metals and select growth proxies. Gold and biotech rank among the relative winners versus the S&P 500 SPY. Crypto proxies and listed real estate are weak. Commodities softened through oil and agriculture price breaks, and broad commodities lagged the S&P 500 SPY. Specialty and commodity leadership is selective.
20-Day Tactical Breadth
Key Takeaways
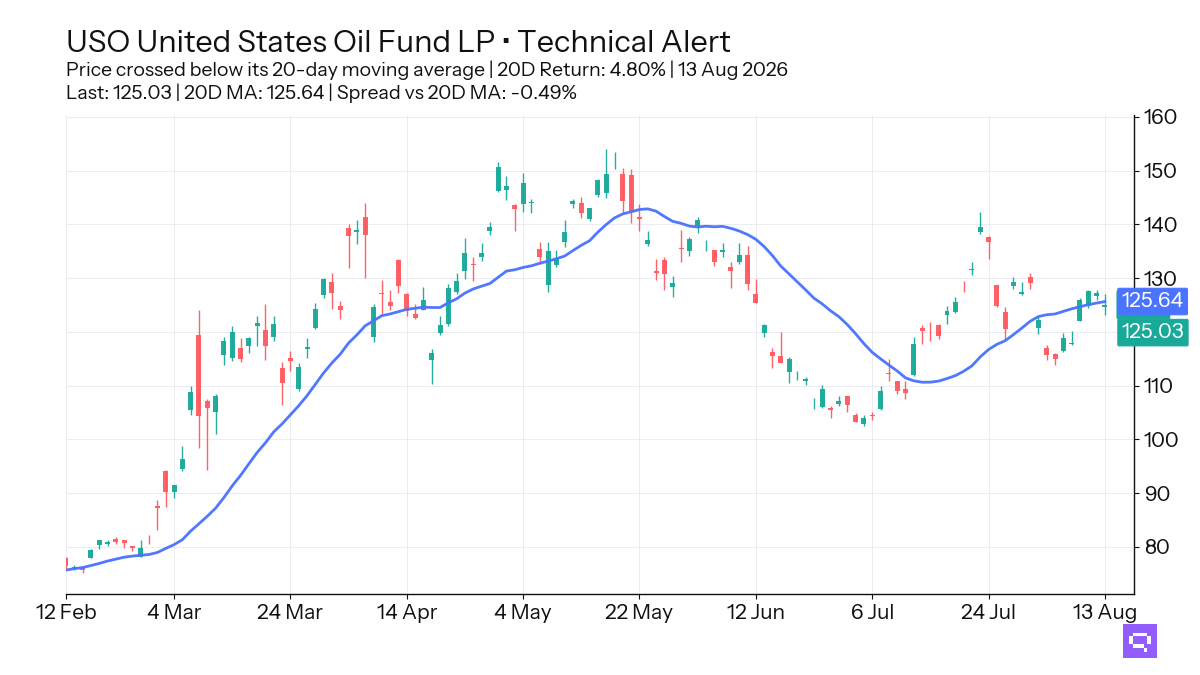
Oil USO, up 4.80% over the trailing 20-day window, crossed below its 20-day moving average. Agriculture Basket DBA also crossed below its 20-day moving average, and Broad Commodities PDBC crossed below its 20-day ratio moving average versus the S&P 500 SPY. Commodity pressure extends from outright price breaks into relative performance.
7-10yr Treasuries IEF crossed above its 20-day moving average and its 20-day ratio moving average versus the Aggregate Bonds AGG. Investment Grade Credit LQD and TIPS TIP also crossed above their 20-day moving averages, while Global Bonds BNDX and Short TIPS VTIP crossed below their 20-day ratio moving averages versus AGG. Bond leadership concentrates in credit and intermediate duration.
Developed Markets EFA, Small-Cap VB, and Healthcare XLV crossed below their 20-day ratio moving averages versus the S&P 500 SPY. China MCHI crossed below its 20-day moving average, and Consumer Staples XLP crossed above its 20-day moving average. The equity laggard cluster spans developed ex-US, domestic size, and domestic defensives.
FEATURED ETF: United States Oil Fund LP USO
Other Technical Signal Events
Equity: Price vs 20-day MA
| Signal | Ticker | Name | 20D perf |
|---|---|---|---|
| Cross-up | XLP | Consumer Staples Select Sector | +0.22% |
| Cross-down | MCHI | iShares MSCI China ETF | +0.52% |
Equity vs SPY: Price Ratio vs 20-day MA
| Signal | Ticker | Name | 20D rel perf |
|---|---|---|---|
| Cross-down | EFA | iShares MSCI EAFE ETF | +1.05% |
| Cross-down | IQLT | iShares MSCI Intl Quality Factor ETF | +0.97% |
| Cross-down | XLV | Health Care Select Sector | +0.43% |
| Cross-down | URTH | iShares MSCI World ETF | +0.27% |
| Cross-down | VB | Vanguard Small-Cap Index ETF | unch. |
Fixed Income: Price vs 20-day MA
| Signal | Ticker | Name | 20D perf |
|---|---|---|---|
| Cross-up | LQD | iShares iBoxx $ Investment Grade Corporate Bond ETF | -0.46% |
| Cross-up | IEF | iShares 7-10 Year Treasury Bond ETF | -0.11% |
| Cross-up | TIP | iShares TIPS Bond ETF | unch. |
Fixed Income vs AGG: Price Ratio vs 20-day MA
| Signal | Ticker | Name | 20D rel perf |
|---|---|---|---|
| Cross-up | IEF | iShares 7-10 Year Treasury Bond ETF | unch. |
| Cross-down | VTIP | Vanguard Short-Term Inflation-Protected Securities Index ETF | +0.26% |
| Cross-down | BNDX | Vanguard Total International Bond Index ETF | +0.25% |
Commodities: Price vs 20-day MA
| Signal | Ticker | Name | 20D perf |
|---|---|---|---|
| Cross-down | USO | United States Oil Fund LP | +4.80% |
| Cross-down | DBA | Invesco DB Agriculture | +0.11% |
Commodities vs SPY: Price Ratio vs 20-day MA
| Signal | Ticker | Name | 20D rel perf |
|---|---|---|---|
| Cross-down | PDBC | Invesco Optimum Yield Diversified Commodity Strategy No K-1 ETF | +1.12% |
Romain Gandon
CEO, Quantlake
Disclaimer: This article is for informational and educational purposes only and does not constitute investment advice. Past performance is not indicative of future results.