.png)

Tactical Trends: Growth Reclaims the Lead as Equity Breadth Splits
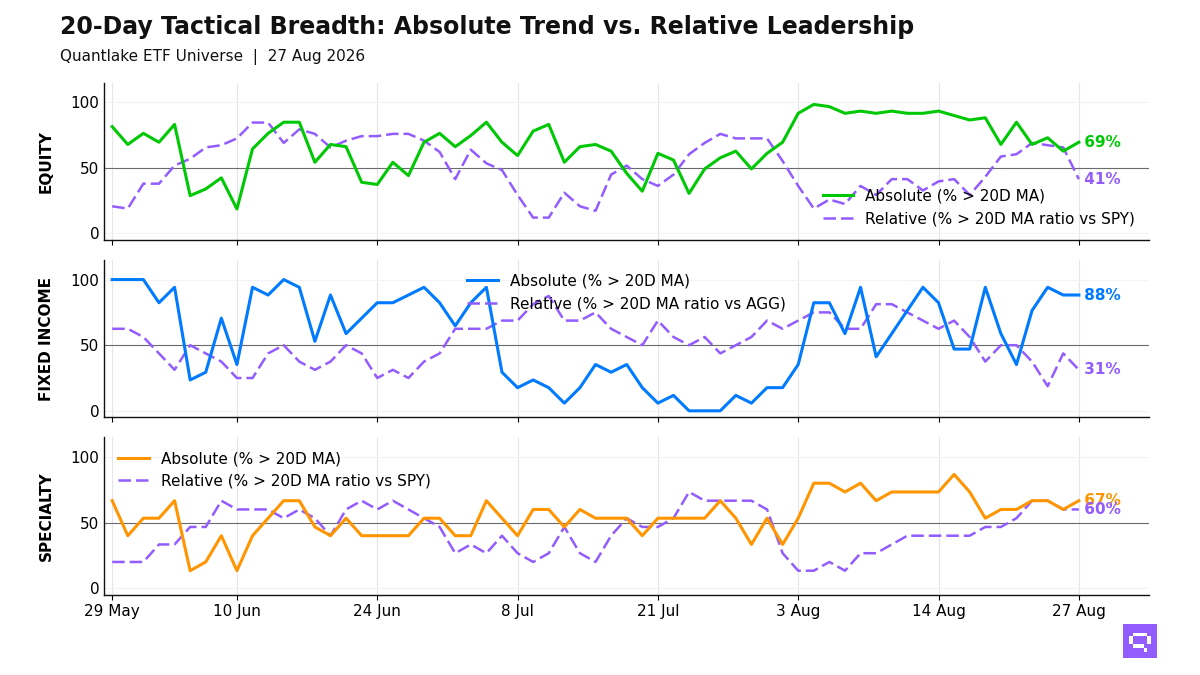
41 of 59 hold above the 20D MA; only 24 of 58 beat SPY.
Technology and growth lead at the August 27 close, with 41 of 59 equity ETFs (69%, +6.8pp) above their 20-day moving average (20D MA) but only 24 of 58 (41%, -24.1pp) above their 20-day ratio moving average vs S&P 500 SPY (20D ratio MA vs SPY). US technology and large-cap growth lead the relative winners, while dividend, small-cap, and developed ex-US exposures lag SPY. Dividend and developed ex-US ETFs also populate the price-above-MA but lagging-benchmark bucket. The +28pp price-relative gap marks a narrow, benchmark-led advance.
Only 5 of 16 bond ETFs beat the Aggregate Bonds AGG. High-yield credit, mortgage-backed securities, and long-duration Treasuries TLT define the relative leader cluster, while intermediate Treasuries, short duration, and EM debt trade above their 20D MA without beating the benchmark. Bond leadership concentrates in spread product with one long-duration outlier.
Semiconductors plus gold and bitcoin proxies lead specialty, and 9 of 15 specialty ETFs beat the S&P 500 SPY. Real estate, clean energy, and infrastructure fill the laggard cluster, and Managed Futures DBMF sits in the price-above-MA but lagging-benchmark bucket. Commodities add selective confirmation through broad commodities and oil, while Copper CPER crossed below its 20D MA and its 20D ratio MA vs S&P 500 SPY. The specialty and commodity mix is selective, with precious-metal and digital-asset strength offset by cyclical commodity softness.
20-Day Tactical Breadth
Key Takeaways
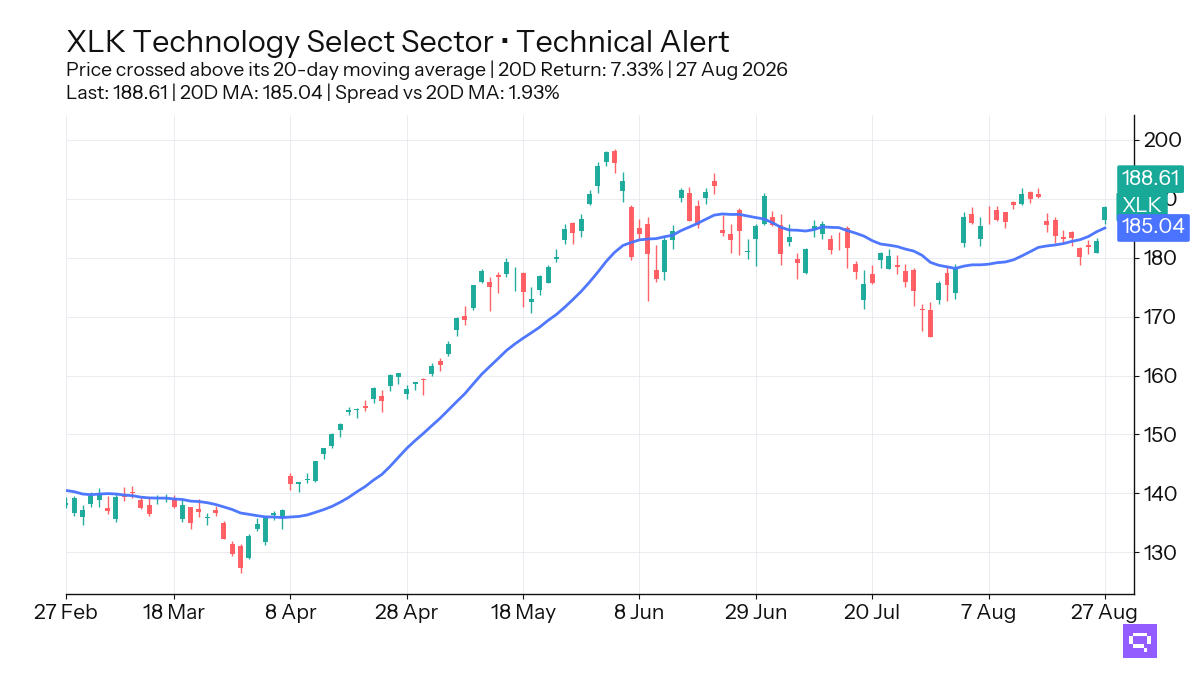
Technology XLK, up 7.33% over the trailing 20-day window, crossed above its 20-day moving average. US Technology IYW and Nasdaq 100 QQQ crossed above their 20D ratio MAs versus S&P 500 SPY, so growth leadership has both absolute and relative confirmation.
Equity cross-timescale alignment stands at 69%. Taiwan equity, quality factor, and equal-weight exposures align as relative leaders versus S&P 500 SPY. Dow-style US equity, China equity, and international momentum align on the laggard side. The cross-timescale map rewards a compact leader set and a broader field of relative laggards.
High-yield credit and mortgage-backed securities lead versus Aggregate Bonds AGG. EM Sovereign Bonds EMB and TIPS TIP lost relative footing through 20D ratio cross-down signals. Managed Futures DBMF crossed above its 20D MA, but it sits in the divergent specialty bucket. Non-equity leadership favors credit beta and selective specialty strength rather than broad confirmation.
FEATURED ETF: Technology Select Sector XLK
Other Technical Signal Events
Equity: Price vs 20-day MA
| Signal | Ticker | Name | 20D perf |
|---|---|---|---|
| Cross-up | QUAL | iShares MSCI USA Quality Factor ETF | +2.59% |
| Cross-up | EWJ | iShares MSCI Japan ETF | +2.73% |
| Cross-up | VTI | Vanguard Total Stock Market Index ETF | +3.92% |
| Cross-up | QQQ | Invesco QQQ | +5.49% |
| Cross-up | IWF | iShares Russell 1000 Growth ETF | +5.50% |
| Cross-up | SPYG | S&P 500 Growth ETF | +5.52% |
| Cross-up | IYW | iShares U.S. Technology ETF | +7.11% |
| Cross-up | XLK | Technology Select Sector | +7.33% |
| Cross-down | VB | Vanguard Small-Cap Index ETF | +2.87% |
| Cross-down | SDY | SPDR S&P Dividend ETF | +1.33% |
| Cross-down | VIG | Vanguard Dividend Appreciation Index ETF | +1.32% |
| Cross-down | XLP | Consumer Staples Select Sector | -0.46% |
| Cross-down | XLRE | The Real Estate Select Sector | -1.41% |
Equity vs SPY: Price Ratio vs 20-day MA
| Signal | Ticker | Name | 20D rel perf |
|---|---|---|---|
| Cross-up | QQQ | Invesco QQQ | +1.47% |
| Cross-up | IWF | iShares Russell 1000 Growth ETF | +1.48% |
| Cross-up | SPYG | S&P 500 Growth ETF | +1.49% |
| Cross-up | IYW | iShares U.S. Technology ETF | +3.03% |
| Cross-up | XLK | Technology Select Sector | +3.24% |
| Cross-down | XLC | Communication Services Select Sector | +0.54% |
| Cross-down | VB | Vanguard Small-Cap Index ETF | -1.06% |
| Cross-down | IMTM | iShares MSCI Intl Momentum Factor ETF | -1.15% |
| Cross-down | DIA | SPDR Dow Jones Industrial Average ETF | -1.20% |
| Cross-down | VO | Vanguard Mid-Cap Index ETF | -1.32% |
| Cross-down | SPYV | S&P 500 Value ETF | -1.77% |
| Cross-down | JEPI | JPMorgan Equity Premium Income ETF | -2.16% |
| Cross-down | EFA | iShares MSCI EAFE ETF | -2.20% |
| Cross-down | XLF | Financial Select Sector | -2.33% |
| Cross-down | VYM | Vanguard High Dividend Yield Index ETF | -2.36% |
| Cross-down | VGK | Vanguard FTSE Europe Index ETF | -2.45% |
| Cross-down | SDY | SPDR S&P Dividend ETF | -2.53% |
| Cross-down | VIG | Vanguard Dividend Appreciation Index ETF | -2.54% |
| Cross-down | DVY | iShares Select Dividend ETF | -2.67% |
| Cross-down | IVLU | iShares Edge MSCI Intl Value Factor ETF | -2.74% |
| Cross-down | IDV | iShares International Select Dividend ETF | -3.32% |
| Cross-down | EWU | iShares MSCI United Kingdom ETF | -3.91% |
| Cross-down | XLP | Consumer Staples Select Sector | -4.25% |
| Cross-down | XLRE | The Real Estate Select Sector | -5.17% |
Fixed Income vs AGG: Price Ratio vs 20-day MA
| Signal | Ticker | Name | 20D rel perf |
|---|---|---|---|
| Cross-down | EMB | iShares J.P. Morgan USD Emerging Markets Bond ETF | +0.23% |
| Cross-down | TIP | iShares TIPS Bond ETF | -0.11% |
Specialty: Price vs 20-day MA
| Signal | Ticker | Name | 20D perf |
|---|---|---|---|
| Cross-up | DBMF | iMGP DBi Managed Futures Strategy ETF | +1.23% |
| Cross-up | SMH | VanEck Semiconductor ETF | +6.33% |
| Cross-down | VNQ | Vanguard Real Estate Index ETF | -1.85% |
Specialty vs SPY: Price Ratio vs 20-day MA
| Signal | Ticker | Name | 20D rel perf |
|---|---|---|---|
| Cross-up | SMH | VanEck Semiconductor ETF | +2.27% |
| Cross-down | VNQ | Vanguard Real Estate Index ETF | -5.59% |
Commodities: Price vs 20-day MA
| Signal | Ticker | Name | 20D perf |
|---|---|---|---|
| Cross-down | CPER | United States Copper LP | +1.63% |
Commodities vs SPY: Price Ratio vs 20-day MA
| Signal | Ticker | Name | 20D rel perf |
|---|---|---|---|
| Cross-down | CPER | United States Copper LP | -2.25% |
Romain Gandon
CEO, Quantlake
Disclaimer: This article is for informational and educational purposes only and does not constitute investment advice. Past performance is not indicative of future results.