.png)

Tactical Trends: Growth Reclaims Relative Ground as Value Slips
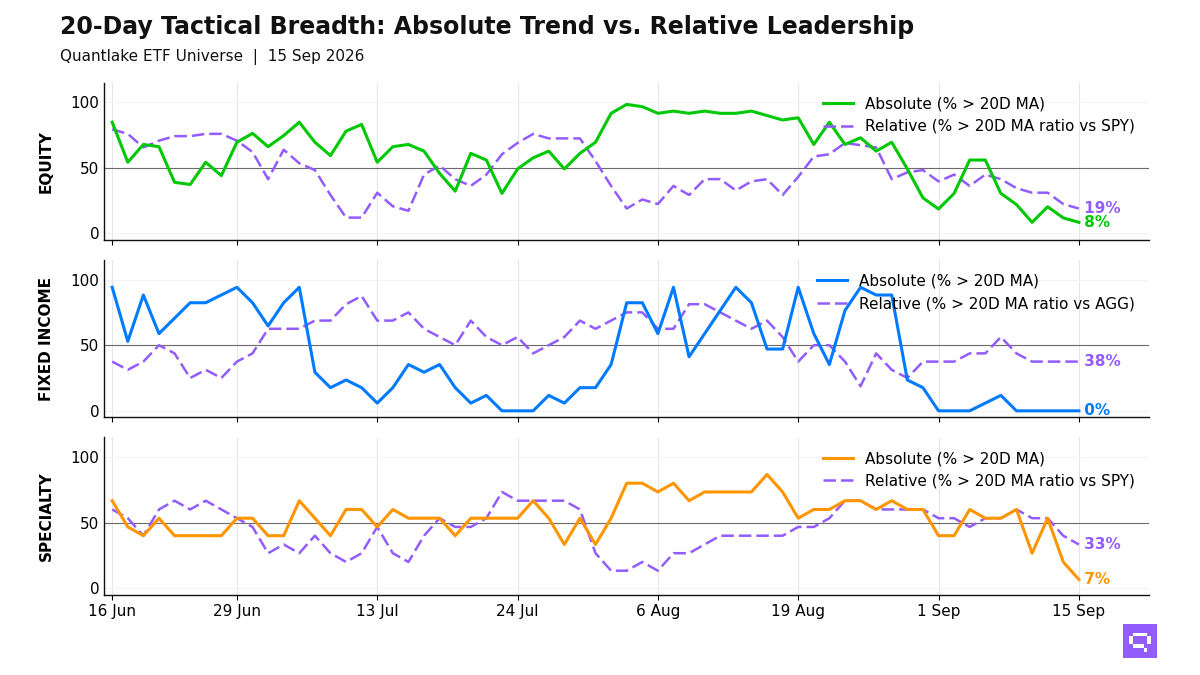
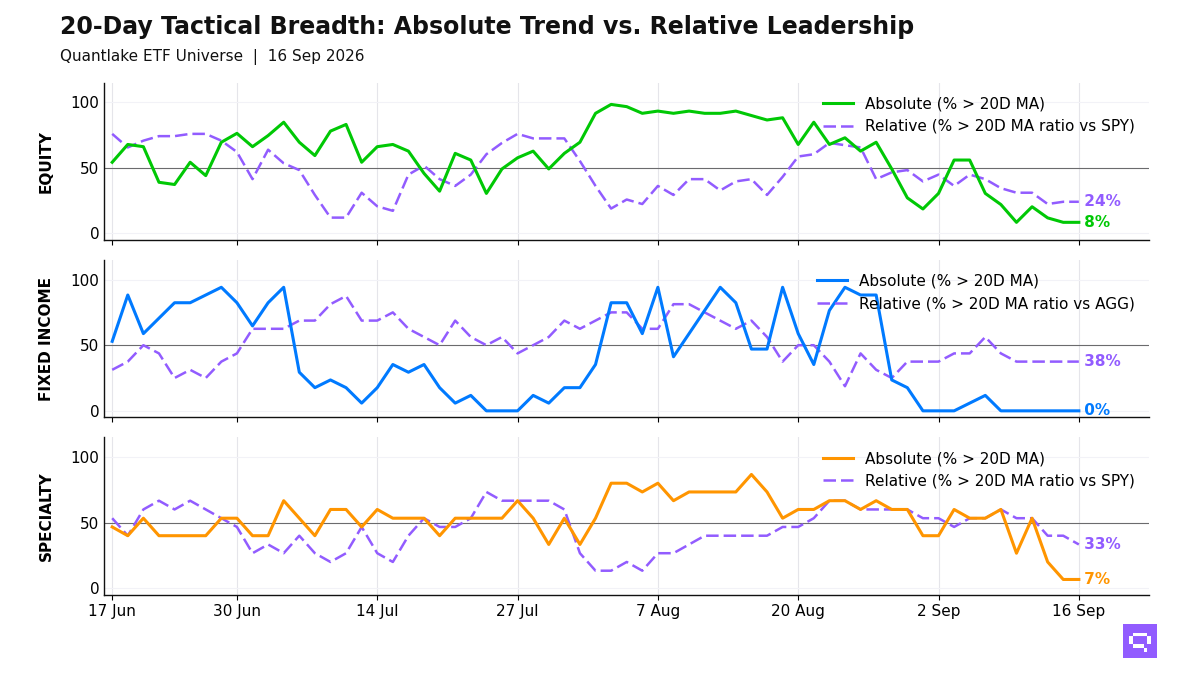
Only 5 of 59 equity ETFs hold above their 20-day moving averages (20D MA)
Nasdaq 100 QQQ and Russell Growth IWF retook relative ground at the September 16 close, crossing above their ratio MAs vs the S&P 500 SPY, while three value and dividend ratios crossed below theirs. Across our ETF universe, 5 of 59 equity ETFs (8%, unchanged on the day) hold above their 20D MA, and 14 of 58 (24%, unchanged on the day) hold above their ratio MA vs the benchmark. Leadership in price concentrates in Asia-Pacific, Brazil, and a narrow US growth-communication cluster. Low-volatility and select growth names sit in the below-price, above-benchmark camp. The equity regime is broad bear, and the negative price-relative gap shows defensive relative strength without broad price confirmation.
Fixed income has 0 of 17 funds above their 20D MA. Relative winners vs the Aggregate Bonds AGG include short duration, high yield, and Investment Grade Credit LQD, while Treasuries and TIPS lag. Leadership in bonds concentrates in credit and lower rate sensitivity.
Only 1 of 15 specialty ETFs holds above its 20D MA, and relative winners vs the S&P 500 SPY are limited to a small alternative and factor cluster, while Bitcoin Trust IBIT joined gold and miners, clean energy, and real estate in the laggard camp. Commodities split between oil and broad baskets on one side and Agriculture Basket DBA's price cross below its moving average on the other. Leadership outside equities is selective.
20-Day Tactical Breadth
Key Takeaways
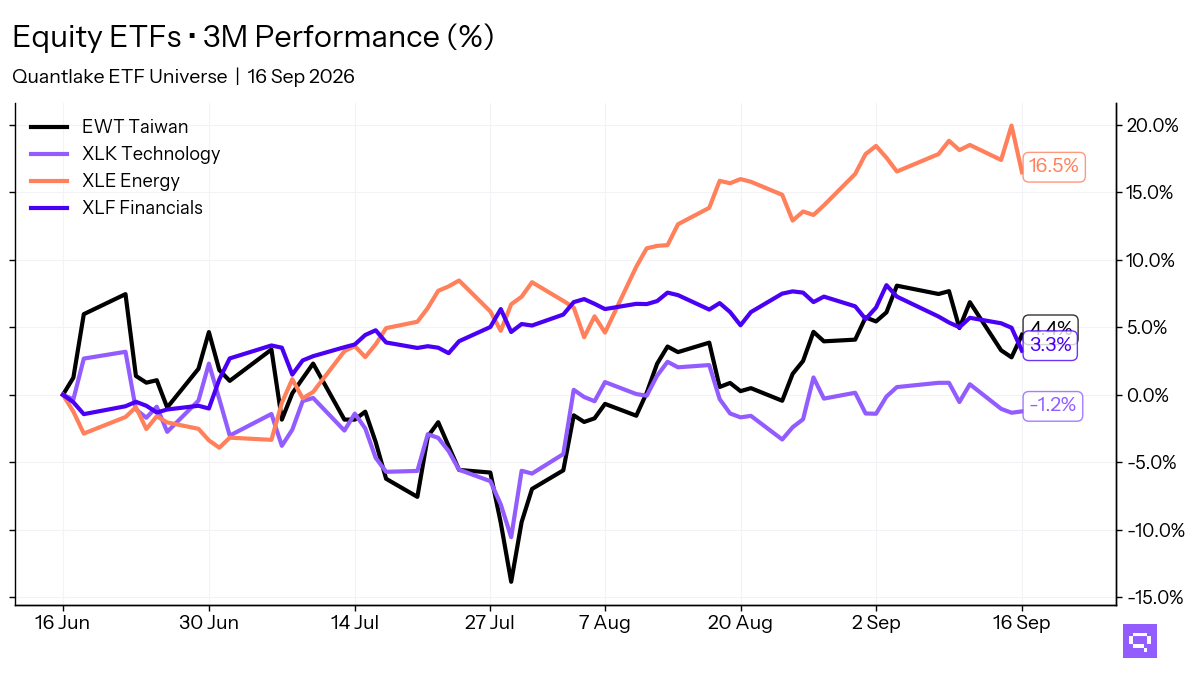
Taiwan EWT crossed above its 20D MA after a 3.84% 20-day return. Equity cross-timescale alignment is 17%, and EWT sits in both the absolute and relative leader sets alongside Asia-Pacific and US growth exposures. Leadership concentrates in a narrow regional-growth pocket.
Investment Grade Credit LQD crossed above its ratio MA vs the Aggregate Bonds AGG. TIPS TIP crossed below its ratio MA vs the benchmark. Cross-timescale fixed-income alignment is 88%, with relative leaders grouped in credit and short duration and laggards concentrated in Treasuries, securitized bonds, and long duration. The bond split favors credit exposure over duration beta.
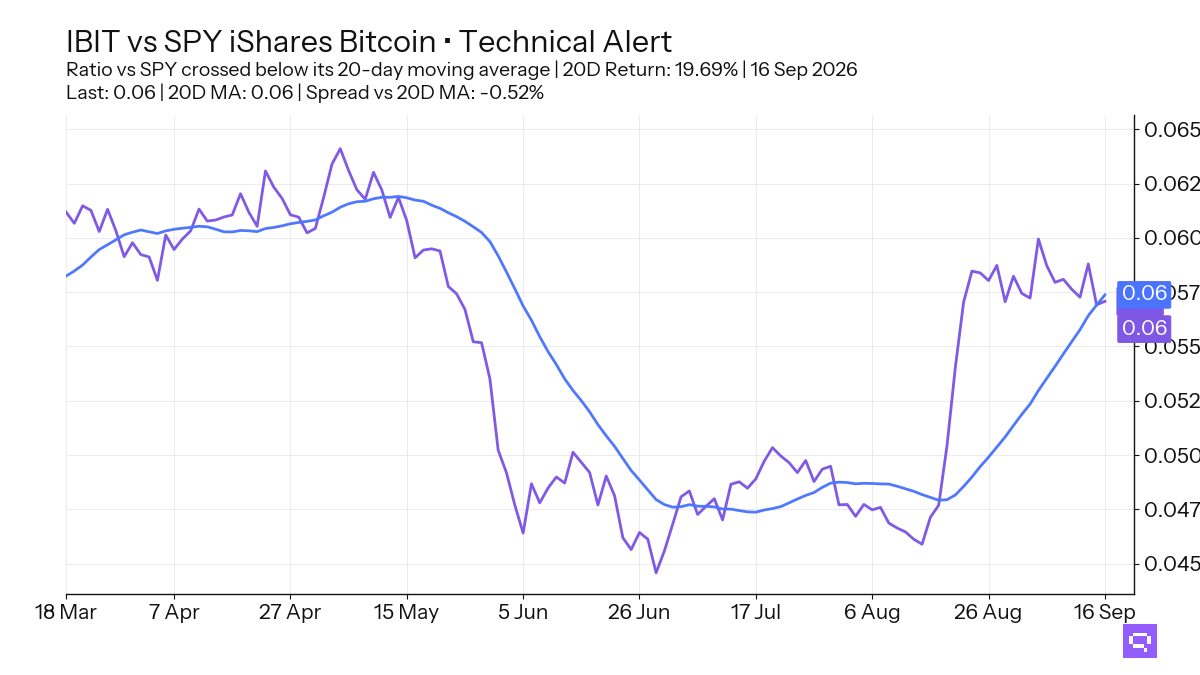
Bitcoin Trust IBIT, up 19.69% relative to S&P 500 SPY over the trailing 20-day window, crossed below its 20-day ratio moving average (20D ratio MA). Broad Commodities PDBC and Oil USO anchor the commodity leader set, and copper fills the laggard side on a relative basis. Specialty and commodity strength is selective.
FEATURED ETF: iShares Bitcoin IBIT vs SPY
Other Technical Signal Events
Equity: Price vs 20-day MA
| Signal | Ticker | Name | 20D perf |
|---|---|---|---|
| Cross-up | EWT | iShares MSCI Taiwan ETF | +3.84% |
| Cross-down | XLE | Energy Select Sector | +0.55% |
Equity vs SPY: Price Ratio vs 20-day MA
| Signal | Ticker | Name | 20D rel perf |
|---|---|---|---|
| Cross-up | IWF | iShares Russell 1000 Growth ETF | -0.23% |
| Cross-up | QQQ | Invesco QQQ | unch. |
| Cross-up | SPYG | S&P 500 Growth ETF | +0.18% |
| Cross-down | VLUE | iShares MSCI USA Value Factor ETF | +0.28% |
| Cross-down | SPYV | S&P 500 Value ETF | -0.12% |
| Cross-down | DVY | iShares Select Dividend ETF | -1.37% |
Fixed Income vs AGG: Price Ratio vs 20-day MA
| Signal | Ticker | Name | 20D rel perf |
|---|---|---|---|
| Cross-up | LQD | iShares iBoxx $ Investment Grade Corporate Bond ETF | +0.35% |
| Cross-down | TIP | iShares TIPS Bond ETF | -0.29% |
Specialty vs SPY: Price Ratio vs 20-day MA
| Signal | Ticker | Name | 20D rel perf |
|---|---|---|---|
| Cross-down | IBIT | iShares Bitcoin | +19.69% |
Commodities: Price vs 20-day MA
| Signal | Ticker | Name | 20D perf |
|---|---|---|---|
| Cross-down | DBA | Invesco DB Agriculture | +2.82% |
Romain Gandon
CEO, Quantlake
Disclaimer: This article is for informational and educational purposes only and does not constitute investment advice. Past performance is not indicative of future results.