


.png)

Tactical Trends: Growth and Global Beta Lose 20D Support at the Close
Relative winners shift to quality, low volatility, and value
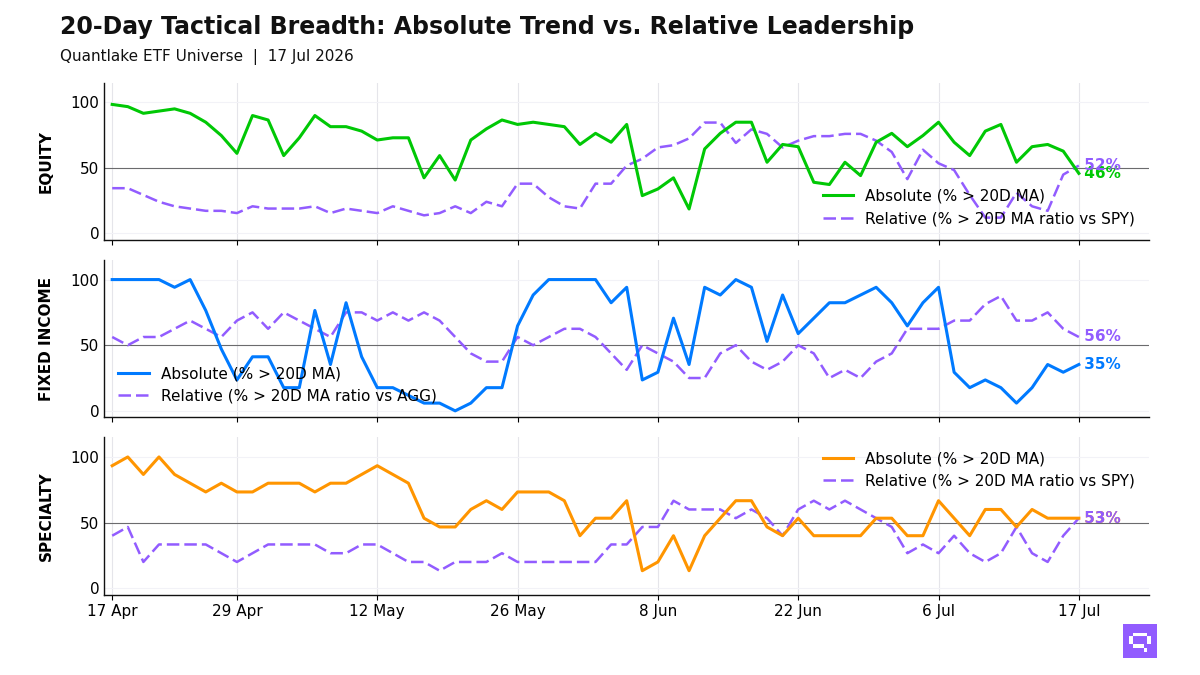
Equity price participation broke lower at the close on July 17. In the ETF universe, 27 of 59 equity ETFs (46%, -17.0pp on the day) hold above their 20-day moving average (20D MA), while 30 of 58 ETFs (52%, +6.9pp) outperform the S&P 500 SPY and hold above their 20-day ratio moving average vs SPY (20D ratio MA vs SPY). US Broad Market VTI crossed below its 20D MA. Low-volatility, quality, and value exposures define the relative winners. Broad-market growth plus Asia and emerging-market exposures fill the laggard cluster. Relative leadership exceeds price participation by 6pp, so the equity read favors defensive rotation without broad price confirmation.
Fixed income leadership is limited to high-yield credit, short duration, and inflation-linked bonds. TIPS TIP crossed above its 20D MA, and only 6 of 17 bond ETFs hold above that level while relative winners vs Aggregate Bonds AGG cluster in credit and short duration and long duration plus preferreds lag. Bond participation concentrates in credit and the front end. Rate sensitivity lags.
Specialty leadership centers on alternatives, real estate, and biotech, with Long/Short Equity FTLS crossing above its 20D ratio MA vs S&P 500 SPY. Gold, miners, and clean energy fill the laggard cluster, and agriculture leads commodities while silver lags on both price and relative terms. The specialty read favors equity substitutes and alternative beta over metals exposure.
20-Day Tactical Breadth
Key Takeaways
Utilities XLU, up 2.25% over the trailing 20-day window, crossed below its 20-day moving average. Consumer Discretionary XLY crossed below its 20D MA and below its 20D ratio MA versus S&P 500 SPY. Sector rotation lost confirmation in defensive yield and cyclical consumption.
TIPS TIP crossed above its 20D MA, and Mortgage-Backed MBB crossed below its 20D ratio MA versus Aggregate Bonds AGG. Fixed-income cross-timescale alignment is 65%, with high-yield credit and short duration leading across daily, weekly, and monthly horizons. Bond leadership concentrates in credit and the front end; long duration lags.
Min Volatility USMV crossed above its 20D ratio MA versus S&P 500 SPY, and Long/Short Equity FTLS did the same. Gold, miners, and clean energy fill the specialty laggard cluster, and agriculture leads commodities while silver lags on price and relative terms. Specialty and commodity leadership favors equity substitutes and alternative beta over metals exposure.
FEATURED ETF: Utilities Select Sector XLU

Other Technical Signal Events
Equity: Price vs 20-day MA
| Signal | Ticker | Name | 20D perf |
|---|---|---|---|
| Cross-down | XLU | Utilities Select Sector | +2.25% |
| Cross-down | VO | Vanguard Mid-Cap Index ETF | +1.20% |
| Cross-down | DIA | SPDR Dow Jones Industrial Average ETF | +1.15% |
| Cross-down | VTI | Vanguard Total Stock Market Index ETF | +0.63% |
| Cross-down | URTH | iShares MSCI World ETF | +0.45% |
| Cross-down | XLY | Consumer Discretionary Select Sector | +0.16% |
| Cross-down | IVLU | iShares Edge MSCI Intl Value Factor ETF | -0.17% |
| Cross-down | EFA | iShares MSCI EAFE ETF | -0.43% |
| Cross-down | SPYG | S&P 500 Growth ETF | -1.02% |
Equity vs SPY: Price Ratio vs 20-day MA
| Signal | Ticker | Name | 20D rel perf |
|---|---|---|---|
| Cross-up | IVLU | iShares Edge MSCI Intl Value Factor ETF | -0.73% |
| Cross-up | URTH | iShares MSCI World ETF | -0.12% |
| Cross-up | VGK | Vanguard FTSE Europe Index ETF | unch. |
| Cross-up | IQLT | iShares MSCI Intl Quality Factor ETF | +0.14% |
| Cross-up | VO | Vanguard Mid-Cap Index ETF | +0.62% |
| Cross-down | XLY | Consumer Discretionary Select Sector | -0.41% |
Fixed Income: Price vs 20-day MA
| Signal | Ticker | Name | 20D perf |
|---|---|---|---|
| Cross-up | TIP | iShares TIPS Bond ETF | +0.27% |
Fixed Income vs AGG: Price Ratio vs 20-day MA
| Signal | Ticker | Name | 20D rel perf |
|---|---|---|---|
| Cross-down | MBB | iShares MBS ETF | unch. |
Specialty vs SPY: Price Ratio vs 20-day MA
| Signal | Ticker | Name | 20D rel perf |
|---|---|---|---|
| Cross-up | FTLS | First Trust Long/Short Equity ETF | unch. |
| Cross-up | USMV | iShares MSCI USA Min Vol Factor ETF | +1.49% |
Romain Gandon
CEO, Quantlake
Disclaimer: This article is for informational and educational purposes only and does not constitute investment advice. Past performance is not indicative of future results.


