.png)
Tactical Trends: Fixed Income Rebounds Into a Breadth Trap
Credit and duration bounced, yet the benchmark still led
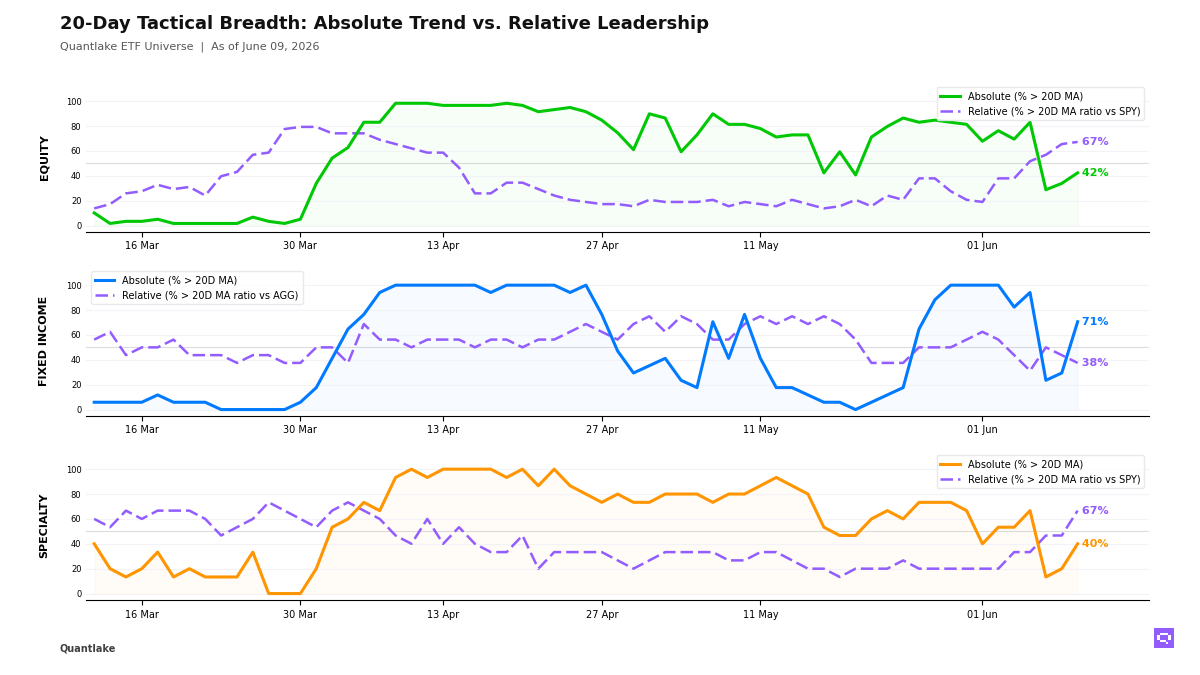
At the close, fixed income delivered the clearest structural shift across our ETF universe. We had 12 of 17 ETFs (71%, +41.2pp) above their 20-day moving average, yet only 6 of 16 outperformed the Aggregate Bonds AGG (38%, -6.2pp), leaving a +33pp gap as High Yield HYG reclaimed its 20-day moving average while losing relative ground and Investment Grade Credit LQD moved above both price and ratio thresholds. We read that as a breadth trap, with price recovery broad across credit and duration but leadership narrowing inside the bond specialty.
Across equity, we had 25 of 59 ETFs (42%, +8.5pp) above their 20-day moving average, while 39 of 58 outperformed the S&P 500 SPY (67%, +1.7pp), as US cyclicals, small caps and defensives improved in price and US growth, emerging markets and China kept lagging the benchmark. Technology XLK slipped below both its 20-day moving average and its ratio moving average versus SPY, while Consumer Staples XLP crossed above both, leaving equity in a mixed regime rather than a broad advance.
In specialty, participation broadened in both dimensions, with 6 of 15 ETFs (40%, +20.0pp) above their 20-day moving average and 10 of 15 outperforming the S&P 500 SPY (67%, +20.0pp), led by Biotechnology IBB and Global REITs REET as bitcoin-linked exposures, gold and gold miners stayed on the relative weak side. Copper CPER crossed above its ratio moving average versus SPY, but silver and agriculture still sat in the cross-timescale laggard camp, so the specialty and commodity mix is broadening selectively rather than confirming a unified cyclical regime.
20-Day Tactical Breadth
Key Takeaways
• Taiwan equity and US smaller-cap and value exposures held the cleanest multi-horizon equity leadership. China, Brazil, Germany, and US growth-sensitive parts of our coverage held the weakest alignment. Equity leadership stayed fragmented across regions and factors rather than synchronized.
• Fixed income showed a clear duration split. Long-duration bonds, international aggregate exposure, and selected credit still outperformed the Aggregate Bonds AGG, while Treasuries and short-duration credit lost relative ground after recovering in price. Short Corporate VCSH captured that split directly by crossing above its 20-day moving average as its ratio versus AGG crossed below. That is a stability signal in short duration, not broad leadership.
• Materials XLB, with a -2.55% period relative return versus SPY, crossed above its 20-day ratio moving average. Long/Short Equity FTLS also improved versus the S&P 500 SPY, while clean energy, gold, gold miners, and bitcoin-linked specialty exposures remained the relative laggards. That mix shows selective stabilization inside cyclical and alternative exposures, not a broad specialty rotation.
FEATURED ETF — Materials Select Sector XLB vs SPY

Other Technical Signal Events
EQUITY
↗ Price breakouts (cross-up 20D MA)
• IWM - iShares Russell 2000 ETF · 20D perf: -0.11%
• MDYG - SPDR® S&P 400 Mid Cap Growth ETF · +0.10%
• JEPI - JPMorgan Equity Premium Income ETF · +0.61%
• SPYV - SPDR® Portfolio S&P 500 Value ETF · +0.86%
• XLP - Consumer Staples Select Sector · +0.88%
• XLRE - SPDR Real Estate Select ETF · +0.90%
↘ Price breakdowns (cross-down 20D MA)
• XLK - Technology Select Sector · 20D perf: +1.62%
↗ Leadership gains (cross-up 20D MA vs SPY)
• XLB - Materials Select Sector · 20D relative perf: -2.55%
• XLU - Utilities Select Sector · -2.27%
• INDA - iShares MSCI India ETF · -1.52%
• EFAV - iShares MSCI EAFE Min Vol Factor ETF · -1.43%
• VEA - Vanguard FTSE Developed Markets · -1.08%
• IQLT - iShares MSCI Intl Quality Factor ETF · -0.87%
• XLP - Consumer Staples Select Sector · +1.18%
↘ Leadership losses (cross-down 20D MA vs SPY)
• XLK - Technology Select Sector · 20D relative perf: +1.93%
• IYW - iShares U.S. Technology ETF · +0.74%
• XLE - Energy Select Sector · +0.71%
• QQQ - Invesco QQQ · -0.46%
• EWJ - iShares MSCI Japan ETF · -1.12%
• IMTM - iShares MSCI Intl Momentum Factor ETF · -1.66%
FIXED INCOME
↗ Price breakouts (cross-up 20D MA)
• IEF - iShares 7-10 Year Treasury Bond ETF · 20D perf: -0.58%
• MBB - iShares MBS ETF · -0.47%
• VCIT - Vanguard Intermediate-Term Corporate Bond · -0.35%
• LQD - iShares iBoxx $ Investment Grade Corporate Bond ETF · unch.
• VCSH - Vanguard Short-Term Corporate Bond · unch.
• HYG - iShares iBoxx $ High Yield Corporate Bond ETF · unch.
↘ Price breakdowns (cross-down 20D MA)
None on the close
↗ Leadership gains (cross-up 20D MA vs AGG)
• LQD - iShares iBoxx $ Investment Grade Corporate Bond ETF · 20D relative perf: +0.12%
↘ Leadership losses (cross-down 20D MA vs AGG)
• HYG - iShares iBoxx $ High Yield Corporate Bond ETF · 20D relative perf: +0.28%
• VCSH - Vanguard Short-Term Corporate Bond · +0.14%
SPECIALTY
↗ Price breakouts (cross-up 20D MA)
• IBB - iShares Biotechnology ETF · 20D perf: -0.38%
• REET - iShares Global REIT ETF · +0.22%
• VNQ - Vanguard Real Estate ETF · +1.01%
↘ Price breakdowns (cross-down 20D MA)
None on the close
↗ Leadership gains (cross-up 20D MA vs SPY)
• FTLS - First Trust Long/Short Equity ETF · 20D relative perf: -0.53%
• IBB - iShares Biotechnology ETF · unch.
• REET - iShares Global REIT ETF · +0.52%
↘ Leadership losses (cross-down 20D MA vs SPY)
None on the close
COMMODITIES
↗ Price breakouts (cross-up 20D MA)
None on the close
↘ Price breakdowns (cross-down 20D MA)
None on the close
↗ Leadership gains (cross-up 20D MA vs SPY)
• CPER - United States Copper LP · 20D relative perf: -1.71%
↘ Leadership losses (cross-down 20D MA vs SPY)
None on the close
Romain Gandon
CEO, Quantlake
Disclaimer: This article is for informational and educational purposes only and does not constitute investment advice. Past performance is not indicative of future results.