


.png)

Intermediate Trends: Equity Leadership Rotates to Low Volatility and Value
Broad bull breadth holds; the relative winners skew lower beta
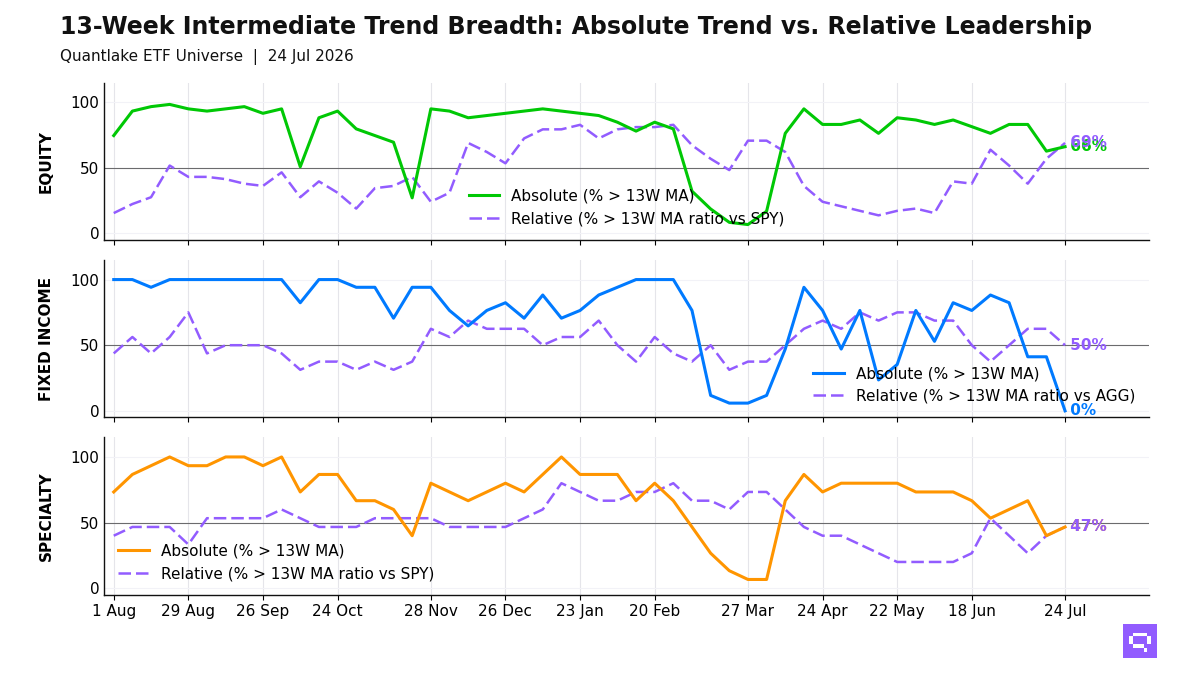
Low-volatility and value leadership define equity conditions on July 24, with 39 of 59 ETFs (66%, +3.4pp) above their 13-week moving average (13W MA) and 40 of 58 (69%, +12.1pp) above their 13-week ratio moving average vs S&P 500 SPY (13W ratio MA vs SPY). Cross-timescale alignment is 53%. The relative leader cluster centers on low-volatility, value, and international income exposures, while US growth and Asia-Pacific equities fill much of the laggard set. The equity regime is broad bull, and leadership leans toward lower-beta and income-oriented exposures.
Fixed income shows no price participation, with 0 of 17 ETFs above their 13W MA. Relative strength vs Aggregate Bonds AGG clusters in shorter duration, intermediate Treasuries, and spread sectors, while long duration, investment grade, and EM debt lag. Bond participation concentrates in shorter duration and mortgage-heavy exposure.
Specialty exposure shows a split profile, with 7 of 15 ETFs above the 13W ratio MA vs S&P 500 SPY as infrastructure, real estate, and minimum-volatility names lead, while clean energy, crypto proxies, and precious metals lag. Commodity signals add a cleaner hard-asset pocket, with Oil USO and Broad Commodities PDBC crossing above both the 13W MA and the 13W ratio MA vs S&P 500 SPY. Hard-asset participation is cleaner than specialty beta.
13-Week Intermediate Breadth
Key Takeaways
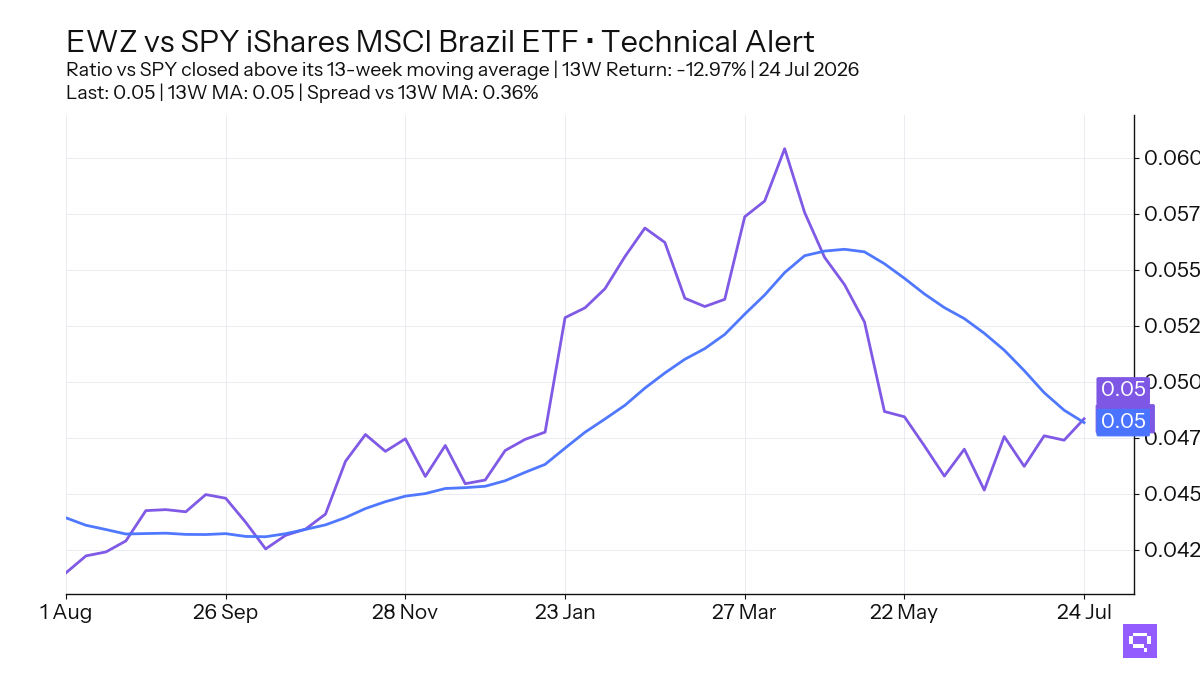
Brazil EWZ, down 9.69% over the trailing 13-week window, crossed above its 13-week moving average. EWZ also crossed above its 13W ratio MA versus S&P 500 SPY, and China Large Cap FXI matched that price and relative turn. Country rotation shifts from outright weakness to early stabilization.
High-yield price broke below the 13W MA across two liquid proxies, and high-yield credit sits in the relative leader cluster versus Aggregate Bonds AGG beside mortgages and intermediate Treasuries. 7-10yr Treasuries IEF and Corporate Credit VCIT crossed below the benchmark on a relative basis. The bond split runs through duration and rate sensitivity, with price weakness across the bucket and selective relative strength in shorter duration.
Infrastructure PAVE crossed above its 13W MA and its 13W ratio MA versus S&P 500 SPY, but specialty alignment is 47%, with clean energy and crypto proxies lagging the bucket. Cross-timescale commodity alignment is 100%, and Copper CPER crossed above both weekly cuts. Hard assets show cleaner confirmation than specialty growth proxies.
FEATURED ETF: iShares MSCI Brazil ETF EWZ
Other Technical Signal Events
Equity: Price vs 13-week MA
| Signal | Ticker | Name | 13W perf |
|---|---|---|---|
| Cross-up | EWZ | iShares MSCI Brazil ETF | -9.7% |
| Cross-up | FXI | iShares China Large-Cap ETF | -5.5% |
| Cross-up | XLB | Materials Select Sector | -0.9% |
| Cross-up | IMTM | iShares MSCI Intl Momentum Factor ETF | +2.4% |
| Cross-up | MDYG | SPDR S&P 400 Mid Cap Growth ETF | +3.4% |
| Cross-down | VTI | Vanguard Total Stock Market Index ETF | +3.9% |
| Cross-down | VT | Vanguard Total World Stock Index ETF | +2.9% |
Equity vs SPY: Price Ratio vs 13-week MA
| Signal | Ticker | Name | 13W rel perf |
|---|---|---|---|
| Cross-up | EWZ | iShares MSCI Brazil ETF | -13.0% |
| Cross-up | FXI | iShares China Large-Cap ETF | -8.9% |
| Cross-up | XLB | Materials Select Sector | -4.5% |
| Cross-up | XLU | Utilities Select Sector | -2.8% |
| Cross-up | IDV | iShares International Select Dividend ETF | -2.5% |
| Cross-up | IMTM | iShares MSCI Intl Momentum Factor ETF | -1.3% |
| Cross-up | MDYG | SPDR S&P 400 Mid Cap Growth ETF | -0.4% |
Fixed Income: Price vs 13-week MA
| Signal | Ticker | Name | 13W perf |
|---|---|---|---|
| Cross-down | JNK | SPDR Bloomberg High Yield Bond ETF | unch. |
| Cross-down | HYG | iShares iBoxx $ High Yield Corporate Bond ETF | unch. |
| Cross-down | VTIP | Vanguard Short-Term Inflation-Protected Securities Index ETF | -0.1% |
| Cross-down | VCSH | Vanguard Short-Term Corporate Bond Index ETF | -0.1% |
| Cross-down | EMB | iShares J.P. Morgan USD Emerging Markets Bond ETF | -0.4% |
| Cross-down | IEI | iShares 3-7 Year Treasury Bond ETF | -1.1% |
| Cross-down | VGIT | Vanguard Intermediate-Term Treasury Index ETF | -1.2% |
Fixed Income vs AGG: Price Ratio vs 13-week MA
| Signal | Ticker | Name | 13W rel perf |
|---|---|---|---|
| Cross-up | MBB | iShares MBS ETF | unch. |
| Cross-up | BNDX | Vanguard Total International Bond Index ETF | +1.1% |
| Cross-down | EMB | iShares J.P. Morgan USD Emerging Markets Bond ETF | +0.8% |
| Cross-down | MUB | iShares National Muni Bond ETF | +0.2% |
| Cross-down | VCIT | Vanguard Intermediate-Term Corporate Bond Index ETF | -0.1% |
| Cross-down | IEF | iShares 7-10 Year Treasury Bond ETF | -0.5% |
Specialty: Price vs 13-week MA
| Signal | Ticker | Name | 13W perf |
|---|---|---|---|
| Cross-up | PAVE | Global X U.S. Infrastructure Development ETF | +3.0% |
Specialty vs SPY: Price Ratio vs 13-week MA
| Signal | Ticker | Name | 13W rel perf |
|---|---|---|---|
| Cross-up | PAVE | Global X U.S. Infrastructure Development ETF | -0.7% |
Commodities: Price vs 13-week MA
| Signal | Ticker | Name | 13W perf |
|---|---|---|---|
| Cross-up | PDBC | Invesco Optimum Yield Diversified Commodity Strategy No K-1 ETF | +0.9% |
| Cross-up | USO | United States Oil Fund LP | +3.2% |
| Cross-up | CPER | United States Copper LP | +3.8% |
Commodities vs SPY: Price Ratio vs 13-week MA
| Signal | Ticker | Name | 13W rel perf |
|---|---|---|---|
| Cross-up | PDBC | Invesco Optimum Yield Diversified Commodity Strategy No K-1 ETF | -2.8% |
| Cross-up | USO | United States Oil Fund LP | -0.5% |
| Cross-up | CPER | United States Copper LP | unch. |
Romain Gandon
CEO, Quantlake
Disclaimer: This article is for informational and educational purposes only and does not constitute investment advice. Past performance is not indicative of future results.


