


.png)

Tactical Trends: US Beta Cracks While Utilities and Asia Outperform
Benchmark outperformance survives in utilities, Asia, and selective growth
Equity participation broke lower into the September 8 close. Eighteen of 59 ETFs (31%, -25.4pp) hold above their 20-day moving average (20D MA), and 24 of 58 (41%, -3.5pp) hold above their ratio MA vs the S&P 500 SPY. Utilities XLU and emerging markets lead the holdout cluster. US broad beta, China, and India sit on the laggard side. Russell Growth IWF also outperforms the benchmark from below its price MA. The equity regime is defensive because benchmark-relative strength survives mainly in ex-US, utilities, and selective growth after broad price participation broke lower.
Fixed income shows only 2 of 17 ETFs above their price MA. EM debt, high yield, and preferred outperform the Aggregate Bonds AGG from below their price MAs. Treasuries and munis lag on a relative basis. Bond leadership concentrates in spread product and short-duration inflation protection.
Specialty participation is selective, with 8 of 15 ETFs above their price MA. Clean Energy ICLN and Momentum Factor MTUM crossed above both their price MAs and their ratio MAs vs the S&P 500 SPY. Commodity leadership concentrates in copper, oil, and broad commodity exposure. Real estate, biotech, and managed futures lag.
20-Day Tactical Breadth

Key Takeaways
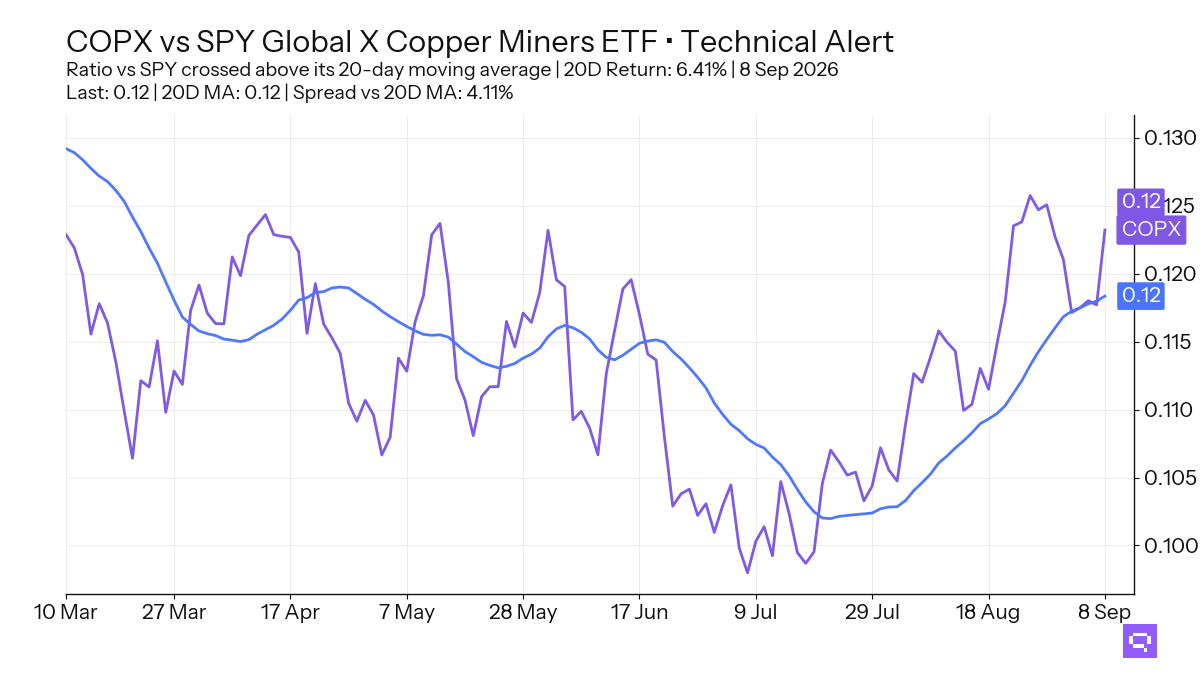
Copper Miners COPX, up 5.44% over the trailing 20-day window, crossed above its 20D MA. The COPX ratio vs the S&P 500 SPY also crossed above its 20-day ratio MA, and equity cross-timescale alignment is 32%. Cross-timescale leadership concentrates in commodity-linked and Asia-Pacific equity.
Utilities XLU, up 0.74% over the trailing 20-day window, crossed above its 20D MA and its ratio MA vs the S&P 500 SPY. Financials XLF, up 0.03% over the trailing 20-day window, crossed below its 20D MA and its ratio MA vs the benchmark. US sector leadership rotated toward defense.
Short TIPS VTIP, up 0.14% over the trailing 20-day window, crossed above its 20D MA. Investment Grade Credit LQD and Preferred Stock PFF crossed above their ratio MAs vs the Aggregate Bonds AGG. Bond relative strength clusters in spread product and short-duration inflation protection.
FEATURED ETF: Global X Copper Miners ETF COPX
Other Technical Signal Events
Equity: Price vs 20-day MA
| Signal | Ticker | Name | 20D perf |
|---|---|---|---|
| Cross-up | XLU | Utilities Select Sector | +0.74% |
| Cross-up | COPX | Global X Copper Miners ETF | +5.44% |
| Cross-down | DVY | iShares Select Dividend ETF | +0.81% |
| Cross-down | SCHD | Schwab U.S. Dividend Equity ETF | +0.64% |
| Cross-down | VT | Vanguard Total World Stock Index ETF | unch. |
| Cross-down | ACWV | iShares MSCI Global Min Vol Factor ETF | -0.15% |
| Cross-down | EFA | iShares MSCI EAFE ETF | -0.23% |
| Cross-down | XLC | Communication Services Select Sector | -0.28% |
| Cross-down | EWU | iShares MSCI United Kingdom ETF | -0.29% |
| Cross-down | URTH | iShares MSCI World ETF | -0.70% |
| Cross-down | XLV | Health Care Select Sector | -0.78% |
| Cross-down | XLF | Financial Select Sector | -0.88% |
| Cross-down | IWF | iShares Russell 1000 Growth ETF | -0.93% |
| Cross-down | VTI | Vanguard Total Stock Market Index ETF | -1.06% |
| Cross-down | SPYG | S&P 500 Growth ETF | -1.32% |
| Cross-down | DIA | SPDR Dow Jones Industrial Average ETF | -1.95% |
| Cross-down | INDA | iShares MSCI India ETF | -2.09% |
| Cross-down | FXI | iShares China Large-Cap ETF | -4.08% |
Equity vs SPY: Price Ratio vs 20-day MA
| Signal | Ticker | Name | 20D rel perf |
|---|---|---|---|
| Cross-up | XLU | Utilities Select Sector | +1.67% |
| Cross-up | COPX | Global X Copper Miners ETF | +6.41% |
| Cross-down | ACWV | iShares MSCI Global Min Vol Factor ETF | +0.77% |
| Cross-down | XLF | Financial Select Sector | unch. |
| Cross-down | INDA | iShares MSCI India ETF | -1.19% |
| Cross-down | FXI | iShares China Large-Cap ETF | -3.20% |
Fixed Income: Price vs 20-day MA
| Signal | Ticker | Name | 20D perf |
|---|---|---|---|
| Cross-up | VTIP | Vanguard Short-Term Inflation-Protected Securities Index ETF | +0.14% |
Fixed Income vs AGG: Price Ratio vs 20-day MA
| Signal | Ticker | Name | 20D rel perf |
|---|---|---|---|
| Cross-up | PFF | iShares Preferred and Income Securities ETF | -0.10% |
| Cross-up | LQD | iShares iBoxx $ Investment Grade Corporate Bond ETF | unch. |
Specialty: Price vs 20-day MA
| Signal | Ticker | Name | 20D perf |
|---|---|---|---|
| Cross-up | MTUM | iShares MSCI USA Momentum Factor ETF | +0.45% |
| Cross-up | ICLN | iShares Global Clean Energy ETF | +1.27% |
| Cross-down | IBB | iShares Biotechnology ETF | +3.65% |
| Cross-down | DBMF | iMGP DBi Managed Futures Strategy ETF | -0.51% |
Specialty vs SPY: Price Ratio vs 20-day MA
| Signal | Ticker | Name | 20D rel perf |
|---|---|---|---|
| Cross-up | MTUM | iShares MSCI USA Momentum Factor ETF | +1.37% |
| Cross-up | ICLN | iShares Global Clean Energy ETF | +2.21% |
| Cross-down | IBB | iShares Biotechnology ETF | +4.61% |
| Cross-down | DBMF | iMGP DBi Managed Futures Strategy ETF | +0.41% |
Romain Gandon
CEO, Quantlake
Disclaimer: This article is for informational and educational purposes only and does not constitute investment advice. Past performance is not indicative of future results.


