.png)
Tactical Trends: Equity Repair Runs Ahead of Relative Leadership
Price participation improved faster than benchmark beating
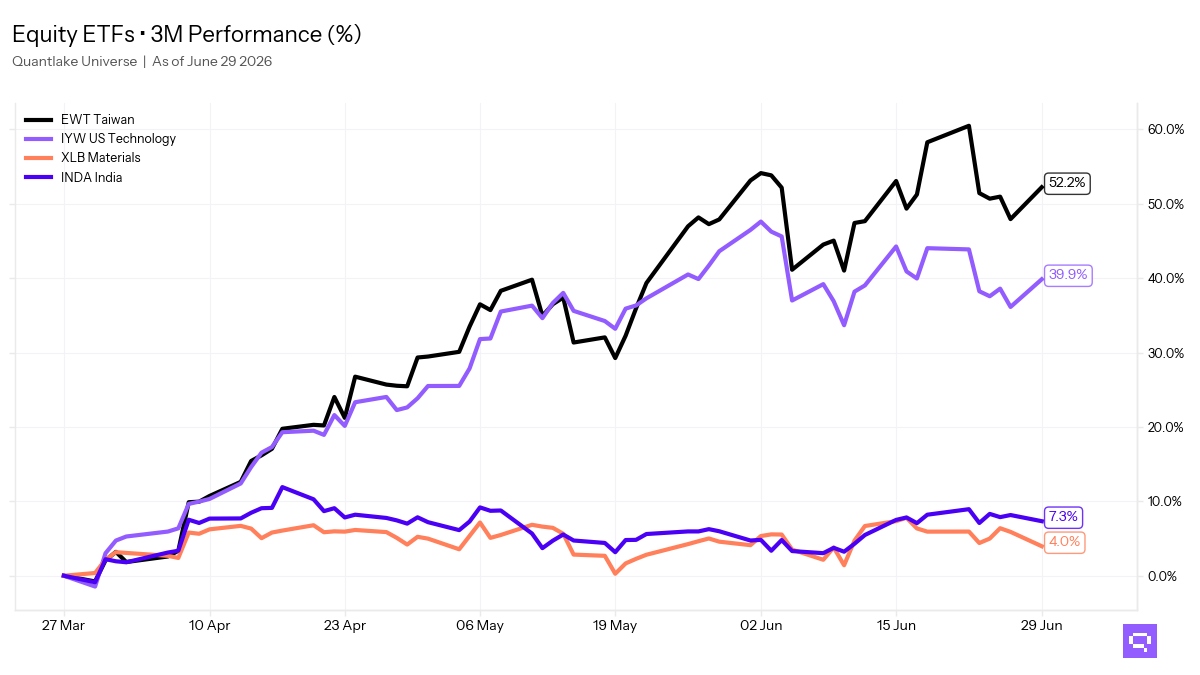
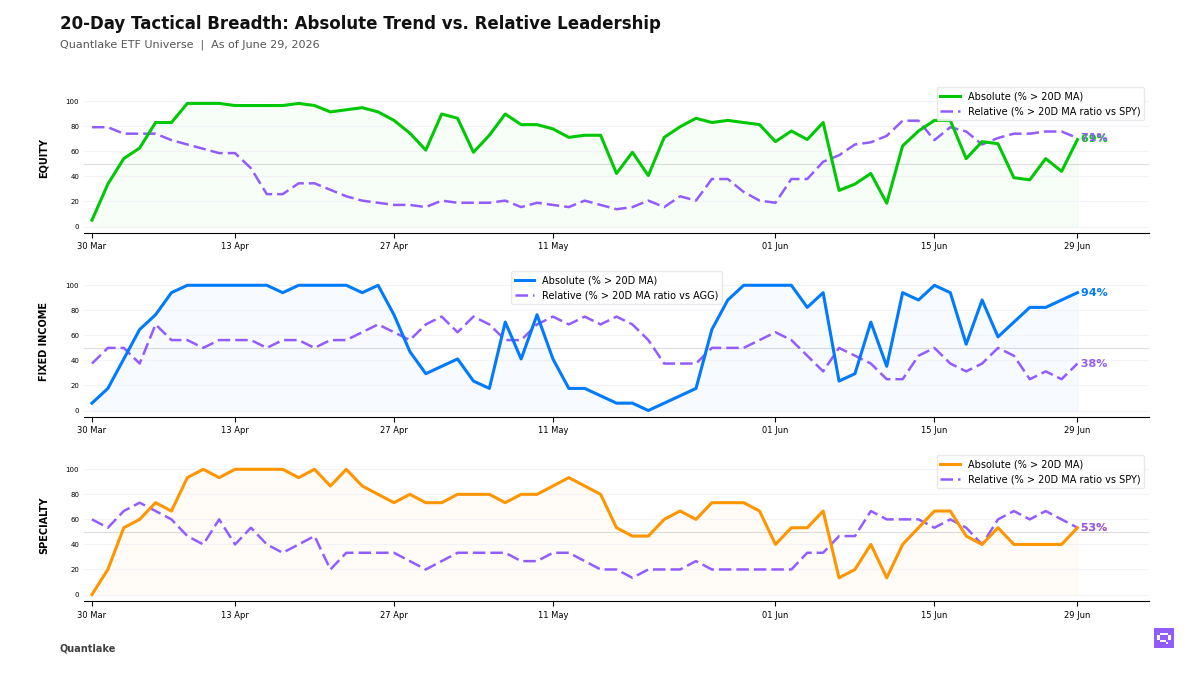
As of June 29, 41 of 59 ETFs (69%, +25.4pp) in our ETF universe sit above their 20-day moving average (20D MA), while 41 of 58 (71%, -5.2pp) hold above their 20-day ratio moving average vs S&P 500 SPY (20D ratio MA vs SPY). Low-volatility, small-cap, developed ex-US, Japan, Taiwan, and dividend-heavy US equity drove the price rebound. Emerging markets, China, Germany, materials, and US growth lagged the benchmark. The equity tape is a price rebound with narrower relative sponsorship.
Fixed income broadened in price, with 16 of 17 ETFs above their 20D MA, and the 57pp price-relative gap shows that benchmark beating vs Aggregate Bonds AGG concentrates in long duration, investment grade credit, mortgages, and EM debt. High yield, short duration, TIPS, munis, and international aggregate sit in the divergent bucket. The bond move is a rate-sensitive rebound with selective credit strength.
Specialty participation improved in price and slipped in relative terms; semiconductors, biotech, covered-call equity, real estate, and low-volatility equity beat the S&P 500 SPY, while gold, bitcoin, alternatives, clean energy, agriculture, and silver lost ground. The specialty and commodity mix favors cyclical technology and real estate over hedges and hard-asset breadth.
20-Day Tactical Breadth
Key Takeaways
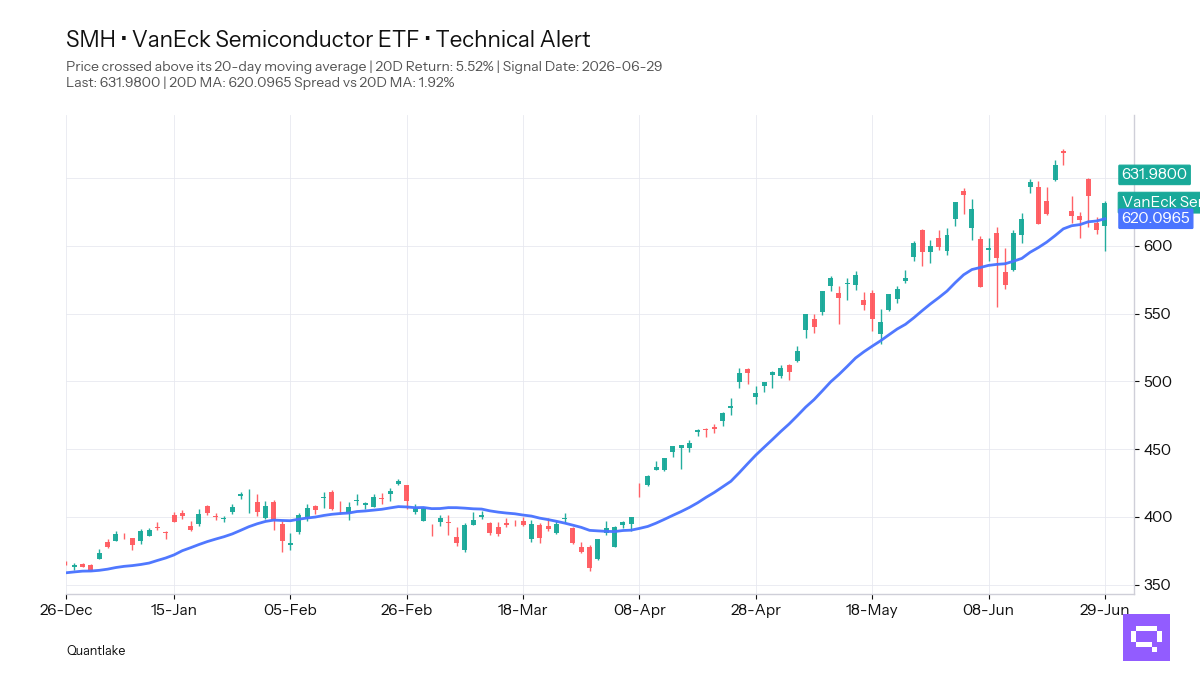
Semiconductors SMH, up 5.52% over the period, crossed above its 20-day moving average. Cross-timescale specialty alignment is 80%, and the leader cluster includes biotech, covered-call equity, momentum, and real estate. The specialty cluster is a selective cyclical rebound.
EM Sovereign Bonds EMB crossed above its 20-day ratio moving average vs Aggregate Bonds AGG, and Investment Grade Credit LQD crossed above its 20D ratio MA vs AGG. Fixed-income alignment sits at 94%, and the relative leader list favors EM debt, investment grade, mortgages, and long duration over short duration, TIPS, and preferreds. The bond hierarchy is duration-led and quality-tilted.
Agriculture Basket DBA crossed below its 20D MA and below its 20D ratio MA vs SPY. Commodity alignment is 20%, and silver, copper, broad commodities, and agriculture populate the relative laggard side. The commodity sleeve is a concentrated weak patch.
FEATURED ETF: VanEck Semiconductor ETF SMH
Other Technical Signal Events
EQUITY
↗ Price breakouts (cross-up 20D MA)
XLY - Consumer Discretionary Select Sector · 20D perf: -2.91%
QQQ - Invesco QQQ · -1.82%
EFAV - iShares MSCI EAFE Min Vol Factor ETF · -1.28%
VTI - Vanguard Total Stock Market Index ETF · -1.17%
URTH - iShares MSCI World ETF · -1.14%
VT - Vanguard Total World Stock Index ETF · -1.09%
VEA - Vanguard FTSE Developed Markets Index ETF · -0.66%
ACWV - iShares MSCI Global Min Vol Factor ETF · -0.40%
EWU - iShares MSCI United Kingdom ETF · -0.25%
SPYV - S&P 500 Value ETF · unch.
VYM - Vanguard High Dividend Yield Index ETF · +0.15%
EFA - iShares MSCI EAFE ETF · +0.27%
VGK - Vanguard FTSE Europe Index ETF · +0.29%
EWJ - iShares MSCI Japan ETF · +0.81%
QUAL - iShares MSCI USA Quality Factor ETF · +1.01%
IMTM - iShares MSCI Intl Momentum Factor ETF · +1.04%
EWT - iShares MSCI Taiwan ETF · +2.93%
↘ Price breakdowns (cross-down 20D MA)
XLB - Materials Select Sector · 20D perf: -0.59%
SCHD - Schwab U.S. Dividend Equity ETF · -0.97%
↗ Leadership gains (cross-up 20D MA vs SPY)
QQQ - Invesco QQQ · 20D relative perf: unch.
URTH - iShares MSCI World ETF · +0.66%
↘ Leadership losses (cross-down 20D MA vs SPY)
XLB - Materials Select Sector · 20D relative perf: +1.23%
SCHD - Schwab U.S. Dividend Equity ETF · +0.84%
VWO - Vanguard FTSE Emerging Markets Index ETF · +0.76%
EEM - iShares MSCI Emerging Markets ETF · +0.61%
IVLU - iShares Edge MSCI Intl Value Factor ETF · +0.57%
FIXED INCOME
↗ Price breakouts (cross-up 20D MA)
VTIP - Vanguard Short-Term Inflation-Protected Securities Index ETF · 20D perf: -0.28%
↘ Price breakdowns (cross-down 20D MA)
None on the close
↗ Leadership gains (cross-up 20D MA vs AGG)
LQD - iShares iBoxx $ Investment Grade Corporate Bond ETF · 20D relative perf: unch.
EMB - iShares J.P. Morgan USD Emerging Markets Bond ETF · +0.18%
↘ Leadership losses (cross-down 20D MA vs AGG)
None on the close
SPECIALTY
↗ Price breakouts (cross-up 20D MA)
JEPQ - JPMorgan Nasdaq Equity Premium Income ETF · 20D perf: +0.19%
SMH - VanEck Semiconductor ETF · +5.52%
↘ Price breakdowns (cross-down 20D MA)
None on the close
↗ Leadership gains (cross-up 20D MA vs SPY)
None on the close
↘ Leadership losses (cross-down 20D MA vs SPY)
FTLS - First Trust Long/Short Equity ETF · 20D relative perf: +1.07%
COMMODITIES
↗ Price breakouts (cross-up 20D MA)
None on the close
↘ Price breakdowns (cross-down 20D MA)
DBA - Invesco DB Agriculture · 20D perf: -2.72%
↗ Leadership gains (cross-up 20D MA vs SPY)
None on the close
↘ Leadership losses (cross-down 20D MA vs SPY)
DBA - Invesco DB Agriculture · 20D relative perf: -0.94%
Romain Gandon
CEO, Quantlake
Disclaimer: This article is for informational and educational purposes only and does not constitute investment advice. Past performance is not indicative of future results.