.png)

Tactical Trends: Equity Leadership Rotates Away From Defensives
Broad price participation masks a 50pp gap to relative leadership
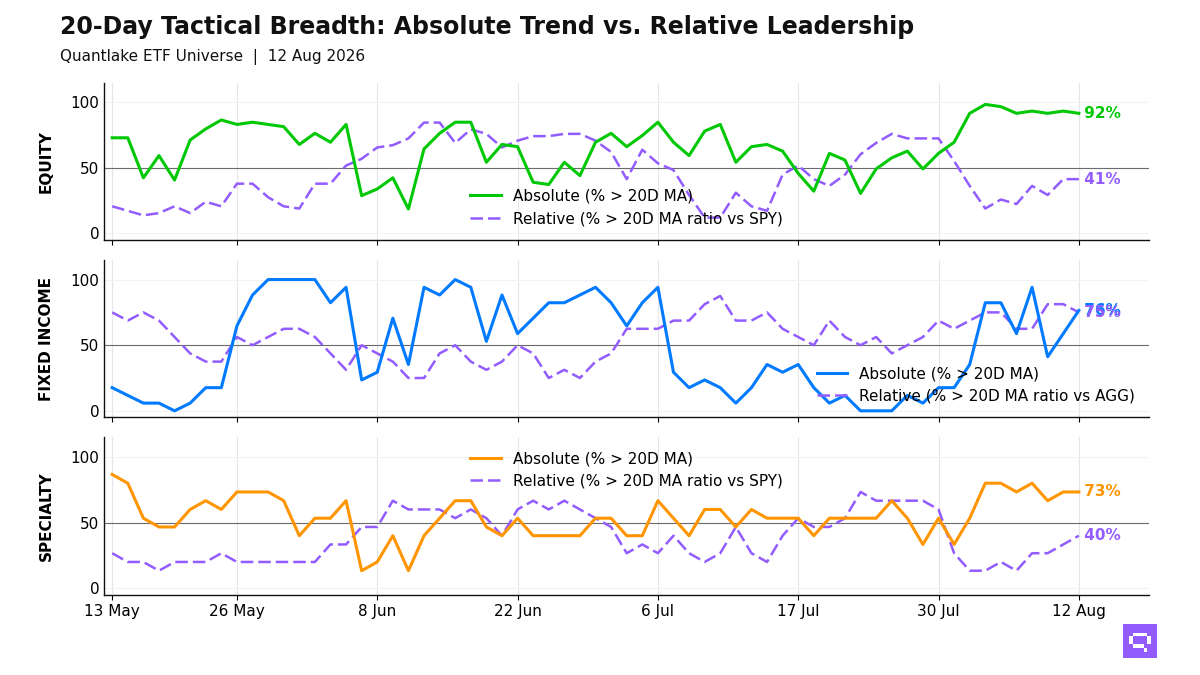
Defensive and income leadership is weaker at the August 12 close, and equity price participation across the ETF universe under coverage is broad. 54 of 59 equity ETFs (92%, -1.7pp) hold above their 20-day moving average (20D MA), while 24 of 58 (41%, unchanged on the day) hold above their 20-day ratio moving average vs the S&P 500 SPY (20D ratio MA vs SPY), a 50pp price-relative gap. Emerging Markets EEM crossed above its 20D ratio MA vs SPY, China Large Cap FXI crossed below its 20D MA, and 10 equity ETFs fill the price-above-MA yet lagging-benchmark cluster, led by low-volatility, dividend, and smaller-cap US exposures. The equity distribution concentrates relative leadership in overseas and growth-oriented exposures.
Fixed income leadership is concentrated in credit and intermediate duration. 12 of 16 bond ETFs hold above their 20D ratio MA vs the Aggregate Bonds AGG, with high yield, mortgages, and short duration in the relative leader cluster. TIPS TIP and long duration populate the laggards, and Mortgage-Backed MBB crossed above its 20D MA. The bond distribution favors spread product and front-end stability over long-duration rate sensitivity.
Specialty leadership is selective, centered on precious metals and selected technology. 6 of 15 specialty ETFs hold above their 20D ratio MA vs the S&P 500 SPY. Semiconductors SMH crossed above its 20D ratio MA vs SPY, and infrastructure, minimum-volatility, and real estate exposures populate the laggard cluster. Agriculture Basket DBA crossed above its 20D MA, and copper lost relative ground vs SPY. The specialty and commodity distribution concentrates strength in metals, semiconductors, and agriculture.
20-Day Tactical Breadth
Key Takeaways
Daily, weekly, and monthly equity studies align at 88%. Asia-Pacific equity and US growth occupy the multi-horizon relative leader cluster. China, the United Kingdom, and defensive sectors populate the laggards. The equity cross-section rewards regional growth leadership, with domestic defensives on the lagging side.
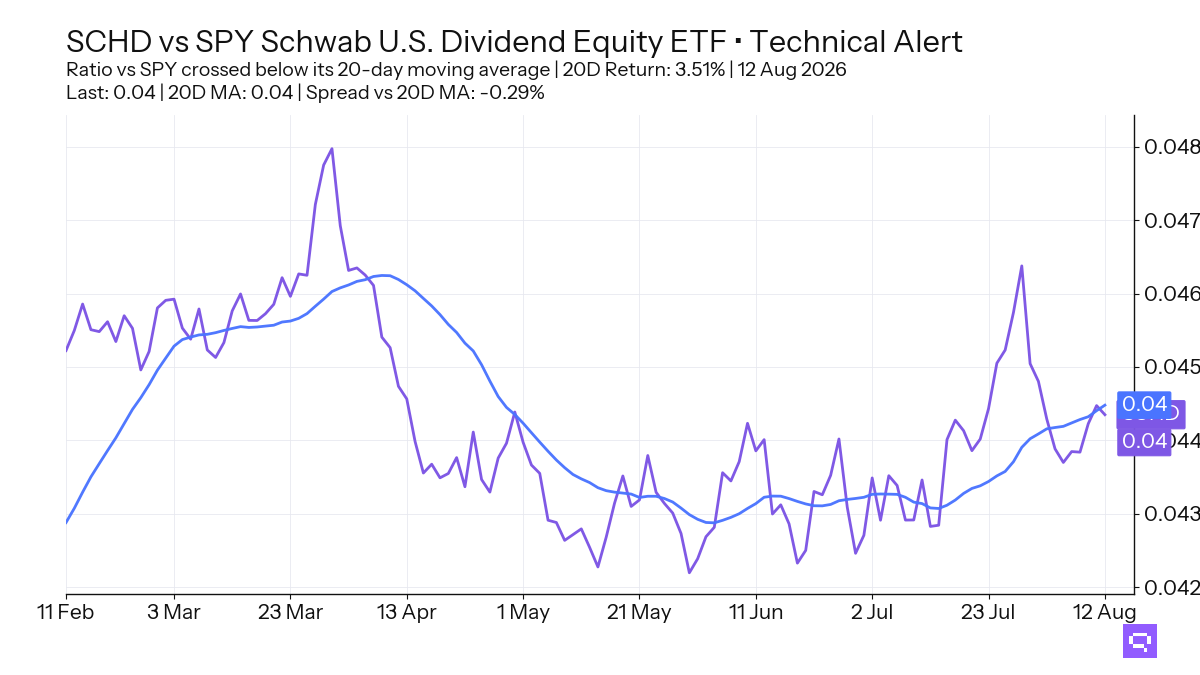
Dividend Quality SCHD, up 3.51% relative to SPY over the trailing 20-day window, crossed below its 20-day ratio moving average. Ten equity ETFs occupy the price-above-MA yet lagging-benchmark cluster, led by low-volatility, dividend, and smaller-cap US exposures. The relative rollback fits a wider defensive fade inside a broad price advance.
Daily, weekly, and monthly fixed-income studies align at 53%. High-yield credit, preferreds, and short duration occupy the multi-horizon leader cluster. Long Treasuries and investment-grade duration lag on both price and relative terms. The bond cross-section concentrates strength in spread product and the front half of the curve.
FEATURED ETF: Schwab U.S. Dividend Equity ETF SCHD vs SPY
Other Technical Signal Events
Equity: Price vs 20-day MA
| Signal | Ticker | Name | 20D perf |
|---|---|---|---|
| Cross-down | FXI | iShares China Large-Cap ETF | +2.77% |
Equity vs SPY: Price Ratio vs 20-day MA
| Signal | Ticker | Name | 20D rel perf |
|---|---|---|---|
| Cross-up | EEM | iShares MSCI Emerging Markets ETF | -0.96% |
| Cross-up | EWY | iShares MSCI South Korea ETF | +0.12% |
| Cross-up | VO | Vanguard Mid-Cap Index ETF | +1.50% |
| Cross-up | VLUE | iShares MSCI USA Value Factor ETF | +2.31% |
| Cross-down | SCHD | Schwab U.S. Dividend Equity ETF | +3.51% |
| Cross-down | XLB | Materials Select Sector | +1.74% |
| Cross-down | VGK | Vanguard FTSE Europe Index ETF | +1.14% |
| Cross-down | XLY | Consumer Discretionary Select Sector | -1.55% |
Fixed Income: Price vs 20-day MA
| Signal | Ticker | Name | 20D perf |
|---|---|---|---|
| Cross-up | VCIT | Vanguard Intermediate-Term Corporate Bond Index ETF | -0.47% |
| Cross-up | MBB | iShares MBS ETF | -0.32% |
Fixed Income vs AGG: Price Ratio vs 20-day MA
| Signal | Ticker | Name | 20D rel perf |
|---|---|---|---|
| Cross-down | TIP | iShares TIPS Bond ETF | unch. |
Specialty vs SPY: Price Ratio vs 20-day MA
| Signal | Ticker | Name | 20D rel perf |
|---|---|---|---|
| Cross-up | SMH | VanEck Semiconductor ETF | -3.27% |
| Cross-up | MTUM | iShares MSCI USA Momentum Factor ETF | -1.64% |
| Cross-up | JEPQ | JPMorgan Nasdaq Equity Premium Income ETF | -1.29% |
| Cross-down | USMV | iShares MSCI USA Min Vol Factor ETF | +2.47% |
| Cross-down | PAVE | Global X U.S. Infrastructure Development ETF | +0.90% |
Commodities: Price vs 20-day MA
| Signal | Ticker | Name | 20D perf |
|---|---|---|---|
| Cross-up | DBA | Invesco DB Agriculture | -0.50% |
Commodities vs SPY: Price Ratio vs 20-day MA
| Signal | Ticker | Name | 20D rel perf |
|---|---|---|---|
| Cross-down | CPER | United States Copper LP | +1.23% |
Romain Gandon
CEO, Quantlake
Disclaimer: This article is for informational and educational purposes only and does not constitute investment advice. Past performance is not indicative of future results.