.png)

Regime Trends: Equity Leaders Thin Out Under Broad August Participation
A 54pp price-relative gap leaves the equity regime broad and selective.
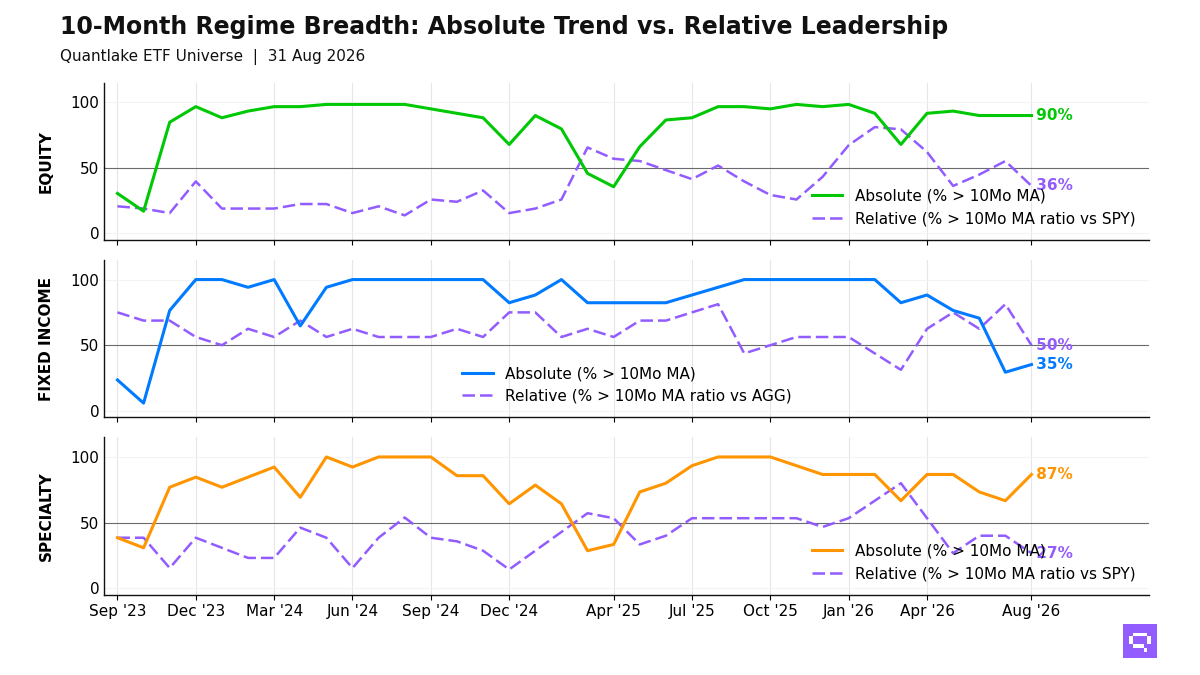
Relative equity leadership contracted into the August 31 close. Across the ETF universe, 53 of 59 equity ETFs (90%, unchanged on the month) hold above their 10-month moving average 10M MA, while only 21 of 58 (36%, -19.0pp) hold above their 10-month ratio moving average versus the S&P 500 SPY, 10M ratio MA vs SPY. Emerging markets EEM and Nasdaq 100 QQQ joined the relative winners. Low-volatility, dividend, and developed ex-US exposures filled the laggard cluster. The 54pp price-relative gap leaves the equity regime broad in price and selective in leadership.
Fixed income participation is limited to 6 of 17 ETFs above their 10M MA, concentrated in high-yield credit, EM debt, and short duration. High-yield credit and short duration outperformed the Aggregate Bonds AGG. Treasuries, investment grade, and international aggregate lagged. The bond split centers on rate sensitivity.
Specialty participation is wide in price and narrow versus the S&P 500 SPY, with Gold Miners GDX and biotech leading the relative winners while real estate and infrastructure lag from above their 10M MA. Crypto trusts crossed above their 10M MA on price. Agriculture Basket DBA joined broad commodity exposure among the names outperforming the S&P 500 SPY. Specialty and commodity leadership concentrates in miners, biotech, and agriculture-linked exposures.
10-Month Regime Breadth
Key Takeaways
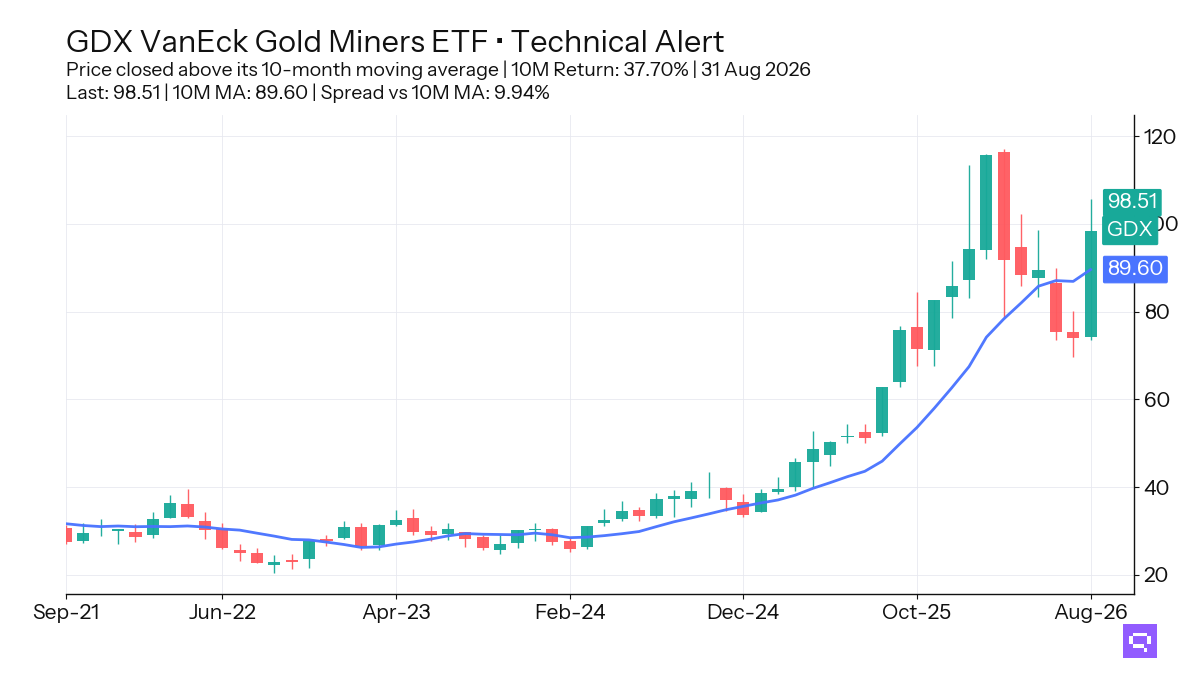
Gold Miners GDX, up 37.70% over the trailing 10-month window, crossed above its 10-month moving average. GDX also crossed above its 10M ratio MA versus the S&P 500 SPY, and specialty cross-timescale alignment is 60%, which places miners among the few specialty groups with both price and relative confirmation.
Copper Miners COPX crossed above its 10M ratio MA versus the S&P 500 SPY after a 36.17% 10-month return, and Healthcare XLV also crossed up on a relative basis. Equity cross-timescale alignment is 29%, so confirmation concentrates in copper miners, Asia-Pacific equity, and selected US growth and value exposures.
Preferred Stock PFF crossed above its 10M MA. High-yield credit and short duration lead versus the Aggregate Bonds AGG across timescales, while TIP and MBB outperform from below their 10M MA. Fixed income alignment is 71%, and the bond winners cluster in lower-duration credit.
FEATURED ETF: VanEck Gold Miners ETF GDX

Other Technical Signal Events
Equity vs SPY: Price Ratio vs 10-month MA
| Signal | Ticker | Name | 10M rel perf |
|---|---|---|---|
| Cross-up | QQQ | Invesco QQQ | +0.9% |
| Cross-up | XLV | Health Care Select Sector | +5.6% |
| Cross-up | EWJ | iShares MSCI Japan ETF | +5.7% |
| Cross-up | EEM | iShares MSCI Emerging Markets ETF | +9.0% |
| Cross-up | COPX | Global X Copper Miners ETF | +36.2% |
| Cross-down | IDV | iShares International Select Dividend ETF | +10.6% |
| Cross-down | VEA | Vanguard FTSE Developed Markets Index ETF | +8.0% |
| Cross-down | DVY | iShares Select Dividend ETF | +5.8% |
| Cross-down | VYM | Vanguard High Dividend Yield Index ETF | +4.7% |
| Cross-down | VB | Vanguard Small-Cap Index ETF | +4.5% |
| Cross-down | IQLT | iShares MSCI Intl Quality Factor ETF | +4.5% |
| Cross-down | MDYG | SPDR S&P 400 Mid Cap Growth ETF | +4.2% |
| Cross-down | EFA | iShares MSCI EAFE ETF | +3.7% |
| Cross-down | VGK | Vanguard FTSE Europe Index ETF | +3.5% |
| Cross-down | EWU | iShares MSCI United Kingdom ETF | +3.4% |
| Cross-down | MDYV | SPDR S&P 400 Mid Cap Value ETF | +2.4% |
| Cross-down | QUAL | iShares MSCI USA Quality Factor ETF | +0.7% |
| Cross-down | VO | Vanguard Mid-Cap Index ETF | +0.6% |
| Cross-down | XLI | Industrial Select Sector | +0.5% |
| Cross-down | DIA | SPDR Dow Jones Industrial Average ETF | -0.3% |
| Cross-down | XLRE | The Real Estate Select Sector | -2.4% |
Fixed Income: Price vs 10-month MA
| Signal | Ticker | Name | 10M perf |
|---|---|---|---|
| Cross-up | PFF | iShares Preferred and Income Securities ETF | +1.8% |
Fixed Income vs AGG: Price Ratio vs 10-month MA
| Signal | Ticker | Name | 10M rel perf |
|---|---|---|---|
| Cross-down | MUB | iShares National Muni Bond ETF | +0.3% |
| Cross-down | VCIT | Vanguard Intermediate-Term Corporate Bond Index ETF | +0.2% |
| Cross-down | IEI | iShares 3-7 Year Treasury Bond ETF | -0.1% |
| Cross-down | VGIT | Vanguard Intermediate-Term Treasury Index ETF | -0.3% |
| Cross-down | BNDX | Vanguard Total International Bond Index ETF | -0.8% |
Specialty: Price vs 10-month MA
| Signal | Ticker | Name | 10M perf |
|---|---|---|---|
| Cross-up | ETHA | iShares Ethereum Trust ETF | -36.2% |
| Cross-up | IBIT | iShares Bitcoin | -28.3% |
| Cross-up | GDX | VanEck Gold Miners ETF | +37.7% |
Specialty vs SPY: Price Ratio vs 10-month MA
| Signal | Ticker | Name | 10M rel perf |
|---|---|---|---|
| Cross-up | GDX | VanEck Gold Miners ETF | +21.4% |
| Cross-down | PAVE | Global X U.S. Infrastructure Development ETF | +0.8% |
| Cross-down | REET | iShares Global REIT ETF | -1.2% |
| Cross-down | VNQ | Vanguard Real Estate Index ETF | -1.9% |
Commodities vs SPY: Price Ratio vs 10-month MA
| Signal | Ticker | Name | 10M rel perf |
|---|---|---|---|
| Cross-up | DBA | Invesco DB Agriculture | +1.6% |
Romain Gandon
CEO, Quantlake
Disclaimer: This article is for informational and educational purposes only and does not constitute investment advice. Past performance is not indicative of future results.