.png)

Tactical Trends: Equity Recovery Spreads as Relative Leaders Thin
Recovered names lag SPY, with strength clustered in dividend and cyclicals.
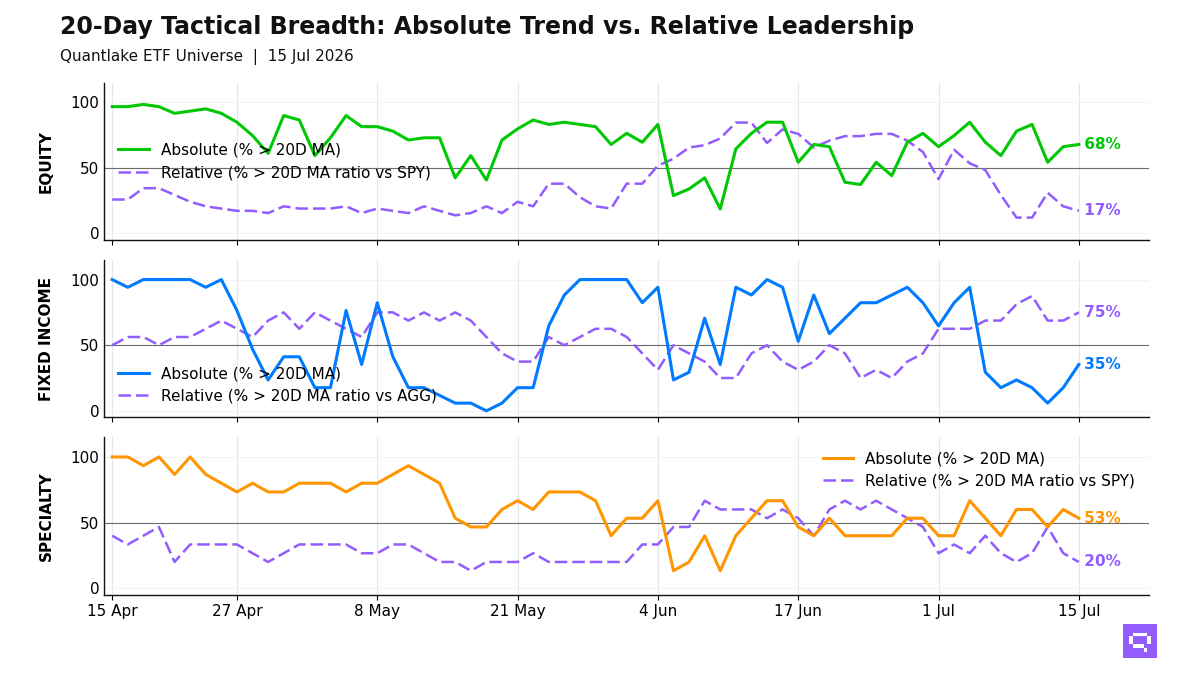
Equity price participation at the close on July 15 is firmer across our ETF universe, with 40 of 59 ETFs (68%, +1.7pp) above their 20-day moving average (20D MA) and only 10 of 58 (17%, -3.5pp) above their 20-day ratio moving average vs S&P 500 SPY (20D ratio MA vs SPY), a 51pp price-relative gap. Low-volatility, US equity, and developed ex-US names anchor the price side. Dividend, sector cyclicals, and China define the relative winners. The configuration resembles a narrow, benchmark-led advance because price recovery runs far ahead of benchmark outperformance.
Fixed income leadership concentrates in high-yield credit, short duration, and intermediate Treasuries, with 12 of 16 beating the Aggregate Bonds AGG and only six of 17 above their 20D MA. Long duration and core aggregate bonds fill the price laggards. The bond cross-section favors stability and intermediate rate exposure over long duration risk.
Crypto and biotech lead specialty, with only 3 of 15 beating the S&P 500 SPY. Managed Futures DBMF and Min Volatility USMV sit in the price-recovery-without-leadership cluster. Commodities add little confirmation because silver lags across timeframes, while copper and agriculture hold the firmer price positions. Specialty and commodity leadership is selective.
20-Day Tactical Breadth
Key Takeaways
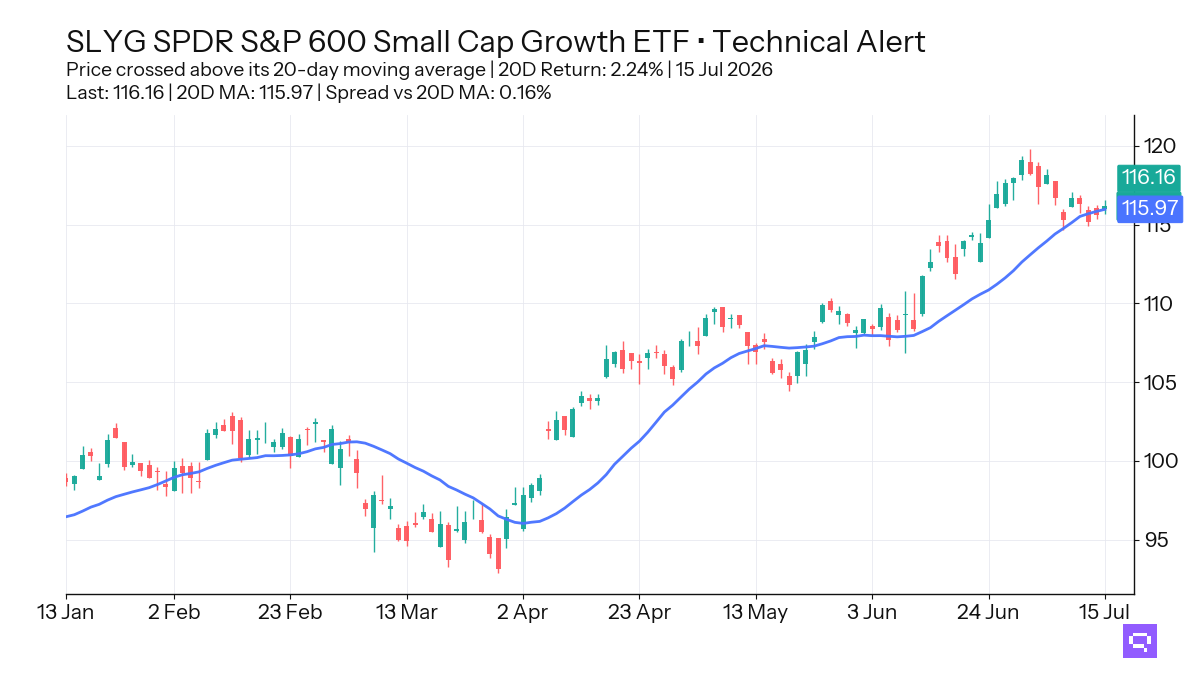
Growth SLYG, up 2.24% over the trailing 20-day window, crossed above its 20-day moving average. Small-cap growth regains price participation. The relative field in equity is tighter than the price field.
7-10yr Treasuries IEF, EM Sovereign Bonds EMB, and Corporate Credit VCIT crossed above their 20D ratio MA vs Aggregate Bonds AGG, and Global Bonds BNDX and Muni Bonds MUB crossed below it. Bond relative strength splits between intermediate duration and selective credit. Long duration does not share the lead.
Specialty alignment is 53%, and Managed Futures DBMF crossed below its 20D ratio MA vs S&P 500 SPY as Min Volatility USMV crossed below its 20D MA. Biotech and crypto define the stronger specialty cluster. Metals and low-volatility alternatives lag the field.
FEATURED ETF: SPDR S&P 600 Small Cap Growth ETF SLYG
Other Technical Signal Events
Equity: Price vs 20-day MA
| Signal | Ticker | Name | 20D perf |
|---|---|---|---|
| Cross-up | VWO | Vanguard FTSE Emerging Markets Index ETF | -2.12% |
| Cross-up | XLY | Consumer Discretionary Select Sector | -1.12% |
| Cross-up | EWG | iShares MSCI Germany ETF | -0.81% |
| Cross-up | SLYG | SPDR S&P 600 Small Cap Growth ETF | +2.24% |
| Cross-down | XLU | Utilities Select Sector | +1.72% |
| Cross-down | SDY | SPDR S&P Dividend ETF | +0.58% |
| Cross-down | EWJ | iShares MSCI Japan ETF | -0.60% |
Equity vs SPY: Price Ratio vs 20-day MA
| Signal | Ticker | Name | 20D rel perf |
|---|---|---|---|
| Cross-down | QUAL | iShares MSCI USA Quality Factor ETF | unch. |
| Cross-down | IWF | iShares Russell 1000 Growth ETF | -0.88% |
Fixed Income: Price vs 20-day MA
| Signal | Ticker | Name | 20D perf |
|---|---|---|---|
| Cross-up | PFF | iShares Preferred and Income Securities ETF | -1.72% |
| Cross-up | IEI | iShares 3-7 Year Treasury Bond ETF | unch. |
| Cross-up | VCSH | Vanguard Short-Term Corporate Bond Index ETF | unch. |
Fixed Income vs AGG: Price Ratio vs 20-day MA
| Signal | Ticker | Name | 20D rel perf |
|---|---|---|---|
| Cross-up | EMB | iShares J.P. Morgan USD Emerging Markets Bond ETF | -0.22% |
| Cross-up | VCIT | Vanguard Intermediate-Term Corporate Bond Index ETF | unch. |
| Cross-up | IEF | iShares 7-10 Year Treasury Bond ETF | +0.18% |
| Cross-down | MUB | iShares National Muni Bond ETF | +0.27% |
| Cross-down | BNDX | Vanguard Total International Bond Index ETF | +0.12% |
Specialty: Price vs 20-day MA
| Signal | Ticker | Name | 20D perf |
|---|---|---|---|
| Cross-down | USMV | iShares MSCI USA Min Vol Factor ETF | -0.26% |
Specialty vs SPY: Price Ratio vs 20-day MA
| Signal | Ticker | Name | 20D rel perf |
|---|---|---|---|
| Cross-down | DBMF | iMGP DBi Managed Futures Strategy ETF | +0.61% |
Romain Gandon
CEO, Quantlake
Disclaimer: This article is for informational and educational purposes only and does not constitute investment advice. Past performance is not indicative of future results.