.png)

Tactical Trends: Equity Reclaims the 20D MA, Cross-Section Lags SPY
Price participation outruns SPY-relative follow-through by 55 points
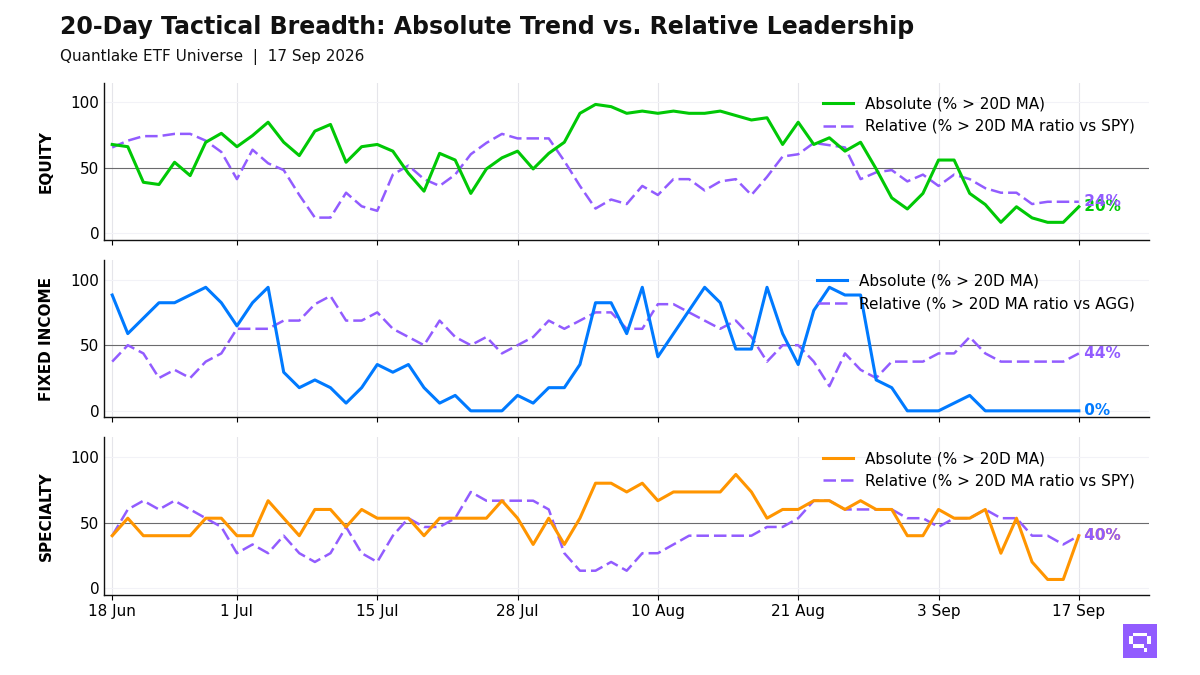
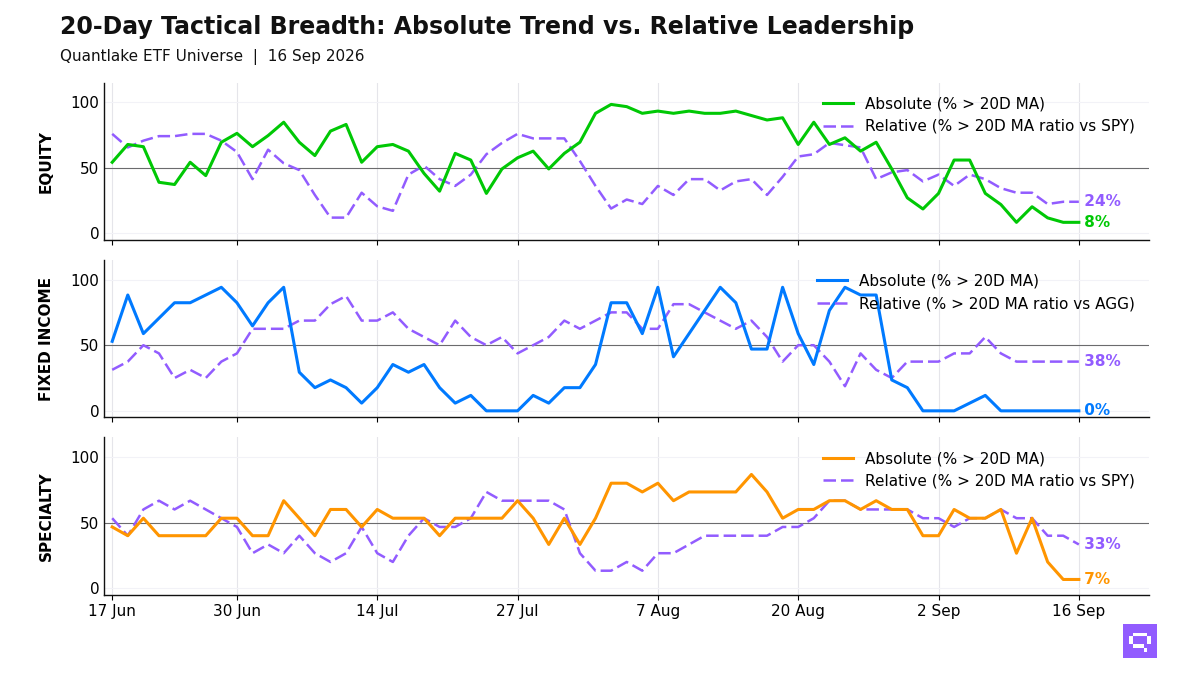
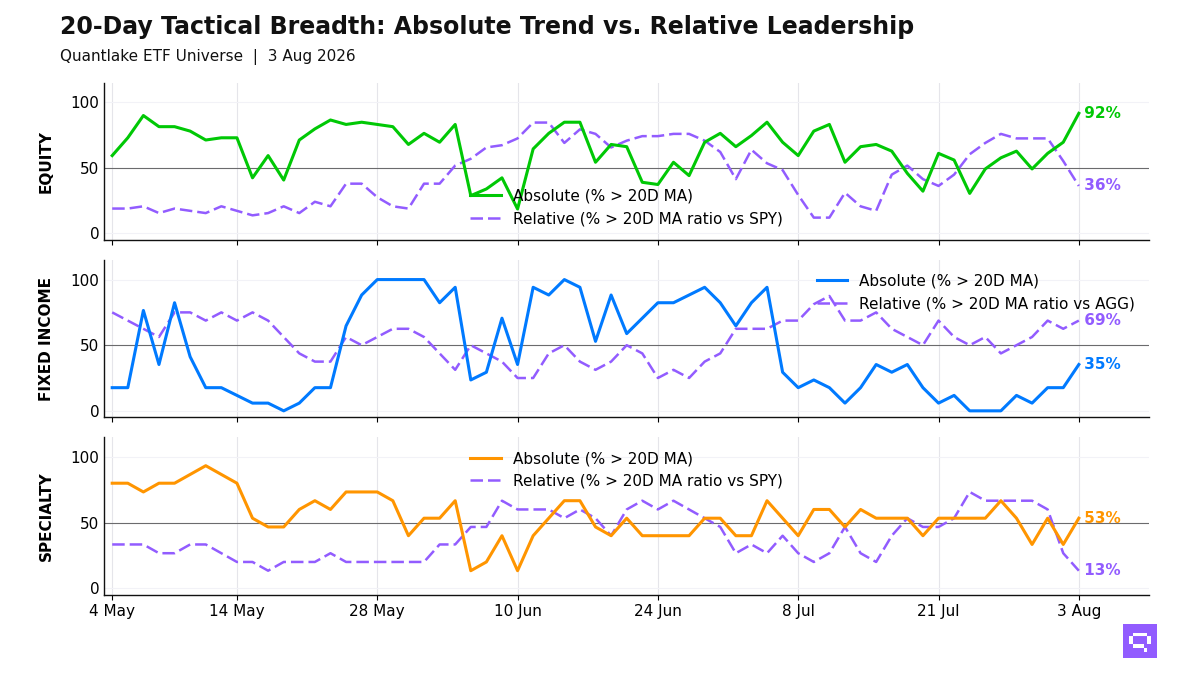
Equity prices closed back above the 20D MA across our ETF universe on August 3, with 54 of 59 ETFs (92%, +22.0pp on the day) above their 20-day moving average (20D MA). Only 21 of 58 ETFs (36%, -19.0pp) hold above their 20-day ratio moving average versus S&P 500 SPY (20D ratio MA vs SPY), a 55pp price-relative gap. Relative leadership concentrates in developed ex-US, China, India, and selective value and quality exposures; U.S. size, momentum, and emerging markets lag. The equity profile pairs broad price recovery with narrow relative confirmation.
Fixed income leadership concentrates in 6 of 17 ETFs above their 20D MA. Global Bonds BNDX and High Yield HYG crossed above their 20D MA. EM Sovereign Bonds EMB beat Aggregate Bonds AGG from below its own average, and long duration plus mortgages lag. Bond participation favors credit and front-end duration, while rate-sensitive duration lacks price confirmation.
Specialty leadership is narrow. Gold Miners GDX and Infrastructure PAVE beat the S&P 500 SPY, while crypto, real estate, and oil lag the benchmark. Specialty and commodity leadership concentrates in miners, infrastructure, and copper, while oil and silver lag.
20-Day Tactical Breadth
Key Takeaways
S&P SmallCap Value SLYV, S&P SmallCap Growth SLYG, and S&P Growth SPYG crossed above their 20D ratio MA versus S&P 500 SPY, while Equal Weight S&P 500 RSP, Developed Markets VEA, and Emerging Markets VWO crossed below. Cross-timescale alignment places value, quality, and selective small-cap exposure in the stronger relative cluster.
EM Sovereign Bonds EMB crossed above its 20D ratio MA versus Aggregate Bonds AGG even though price is below its 20D MA, and the same defensive relative profile appears in intermediate Treasuries and inflation-linked credit. High Yield Bonds JNK joined High Yield HYG above their 20D MA, so bond strength clusters in credit and shorter duration.
Oil USO, up 17.03% over the trailing 20-day window, crossed below its 20-day moving average. USO also crossed below its 20D ratio MA versus S&P 500 SPY, Broad Commodities PDBC did the same, and Gold Miners GDX plus Infrastructure PAVE hold the only specialty relative up-crosses. Hard-asset leadership narrows to miners and copper.
FEATURED ETF: United States Oil Fund LP USO

Other Technical Signal Events
Equity: Price vs 20-day MA
| Signal | Ticker | Name | 20D perf |
|---|---|---|---|
| Cross-up | QQQ | Invesco QQQ | -3.15% |
| Cross-up | MDYG | SPDR S&P 400 Mid Cap Growth ETF | -2.07% |
| Cross-up | XLB | Materials Select Sector | -1.87% |
| Cross-up | IWF | iShares Russell 1000 Growth ETF | -1.73% |
| Cross-up | IYW | iShares U.S. Technology ETF | -1.50% |
| Cross-up | XLI | Industrial Select Sector | -1.29% |
| Cross-up | IWM | iShares Russell 2000 ETF | -0.90% |
| Cross-up | SLYG | SPDR S&P 600 Small Cap Growth ETF | -0.71% |
| Cross-up | VB | Vanguard Small-Cap Index ETF | -0.67% |
| Cross-up | VLUE | iShares MSCI USA Value Factor ETF | -0.56% |
| Cross-up | VTI | Vanguard Total Stock Market Index ETF | +0.58% |
| Cross-up | IJR | iShares Core S&P Small-Cap ETF | +0.72% |
| Cross-up | XLC | Communication Services Select Sector | +1.03% |
Equity vs SPY: Price Ratio vs 20-day MA
| Signal | Ticker | Name | 20D rel perf |
|---|---|---|---|
| Cross-up | SLYG | SPDR S&P 600 Small Cap Growth ETF | -1.55% |
| Cross-up | SPYG | S&P 500 Growth ETF | unch. |
| Cross-up | SLYV | SPDR S&P 600 Small Cap Value ETF | +1.22% |
| Cross-down | ACWV | iShares MSCI Global Min Vol Factor ETF | +1.05% |
| Cross-down | JEPI | JPMorgan Equity Premium Income ETF | +0.85% |
| Cross-down | VYM | Vanguard High Dividend Yield Index ETF | +0.80% |
| Cross-down | MDYV | SPDR S&P 400 Mid Cap Value ETF | +0.70% |
| Cross-down | VO | Vanguard Mid-Cap Index ETF | +0.22% |
| Cross-down | RSP | Invesco S&P 500 Equal Weight ETF | +0.13% |
| Cross-down | SPYV | S&P 500 Value ETF | unch. |
| Cross-down | XLP | Consumer Staples Select Sector | unch. |
| Cross-down | IQLT | iShares MSCI Intl Quality Factor ETF | unch. |
| Cross-down | URTH | iShares MSCI World ETF | -0.16% |
| Cross-down | VIG | Vanguard Dividend Appreciation Index ETF | -0.38% |
| Cross-down | XLV | Health Care Select Sector | -0.67% |
| Cross-down | VEA | Vanguard FTSE Developed Markets Index ETF | -2.02% |
| Cross-down | VWO | Vanguard FTSE Emerging Markets Index ETF | -2.51% |
Fixed Income: Price vs 20-day MA
| Signal | Ticker | Name | 20D perf |
|---|---|---|---|
| Cross-up | BNDX | Vanguard Total International Bond Index ETF | -0.54% |
| Cross-up | HYG | iShares iBoxx $ High Yield Corporate Bond ETF | -0.22% |
| Cross-up | JNK | SPDR Bloomberg High Yield Bond ETF | -0.18% |
Fixed Income vs AGG: Price Ratio vs 20-day MA
| Signal | Ticker | Name | 20D rel perf |
|---|---|---|---|
| Cross-up | EMB | iShares J.P. Morgan USD Emerging Markets Bond ETF | -0.15% |
Specialty: Price vs 20-day MA
| Signal | Ticker | Name | 20D perf |
|---|---|---|---|
| Cross-up | GDX | VanEck Gold Miners ETF | -3.42% |
| Cross-up | JEPQ | JPMorgan Nasdaq Equity Premium Income ETF | -1.84% |
| Cross-up | PAVE | Global X U.S. Infrastructure Development ETF | -0.50% |
Specialty vs SPY: Price Ratio vs 20-day MA
| Signal | Ticker | Name | 20D rel perf |
|---|---|---|---|
| Cross-up | GDX | VanEck Gold Miners ETF | -4.23% |
| Cross-up | PAVE | Global X U.S. Infrastructure Development ETF | -1.34% |
| Cross-down | ETHA | iShares Ethereum Trust ETF | +3.25% |
| Cross-down | REET | iShares Global REIT ETF | +1.08% |
| Cross-down | FTLS | First Trust Long/Short Equity ETF | +0.48% |
| Cross-down | USMV | iShares MSCI USA Min Vol Factor ETF | -0.46% |
Commodities: Price vs 20-day MA
| Signal | Ticker | Name | 20D perf |
|---|---|---|---|
| Cross-down | USO | United States Oil Fund LP | +17.03% |
Commodities vs SPY: Price Ratio vs 20-day MA
| Signal | Ticker | Name | 20D rel perf |
|---|---|---|---|
| Cross-down | USO | United States Oil Fund LP | +16.04% |
| Cross-down | PDBC | Invesco Optimum Yield Diversified Commodity Strategy No K-1 ETF | +6.24% |
Romain Gandon
CEO, Quantlake
Disclaimer: This article is for informational and educational purposes only and does not constitute investment advice. Past performance is not indicative of future results.