.png)

Tactical Trends: Equity Leadership Rotates to Cyclicals and Internationals
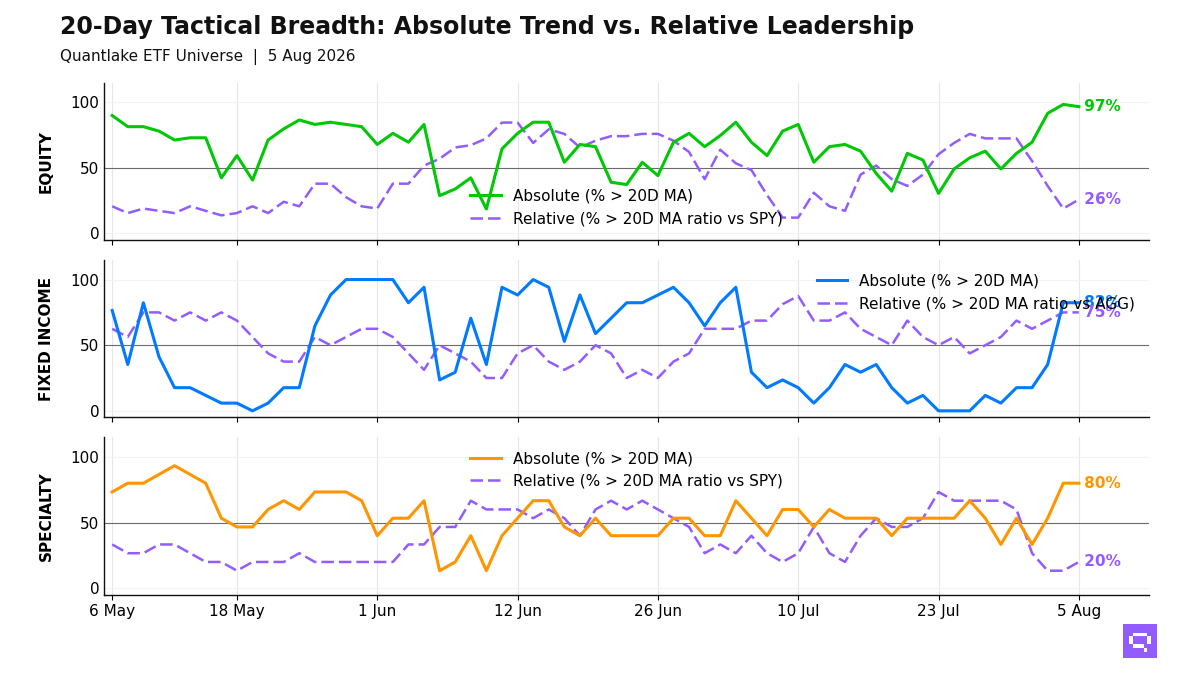
Broad price participation masks a 71pp gap vs relative leadership
Cyclical and international relative strength defined the ETF universe at the August 5 close, with 57 of 59 equity ETFs (97%, -1.7pp) above their 20-day moving average (20D MA) and 15 of 58 (26%, +6.9pp) above their 20-day ratio moving average vs the S&P 500 SPY (20D ratio MA vs SPY). Six equity ratio cross-ups landed in cyclical and international exposures. Two growth-oriented ratios crossed below their 20D ratio MA vs SPY, and Energy XLE crossed below its 20D MA. Nasdaq 100 QQQ was one of those laggards. The 71pp price-relative gap is consistent with an advance that is broad in price and selective in leadership.
Fixed income leadership concentrated in credit and intermediate duration, with 12 of 16 outpacing the Aggregate Bonds AGG and laggards limited to long duration, inflation-linked exposure, and munis. Preferreds, short-duration credit, and the Treasury belly led momentum. The bond distribution rewards credit and intermediate duration more than duration extension.
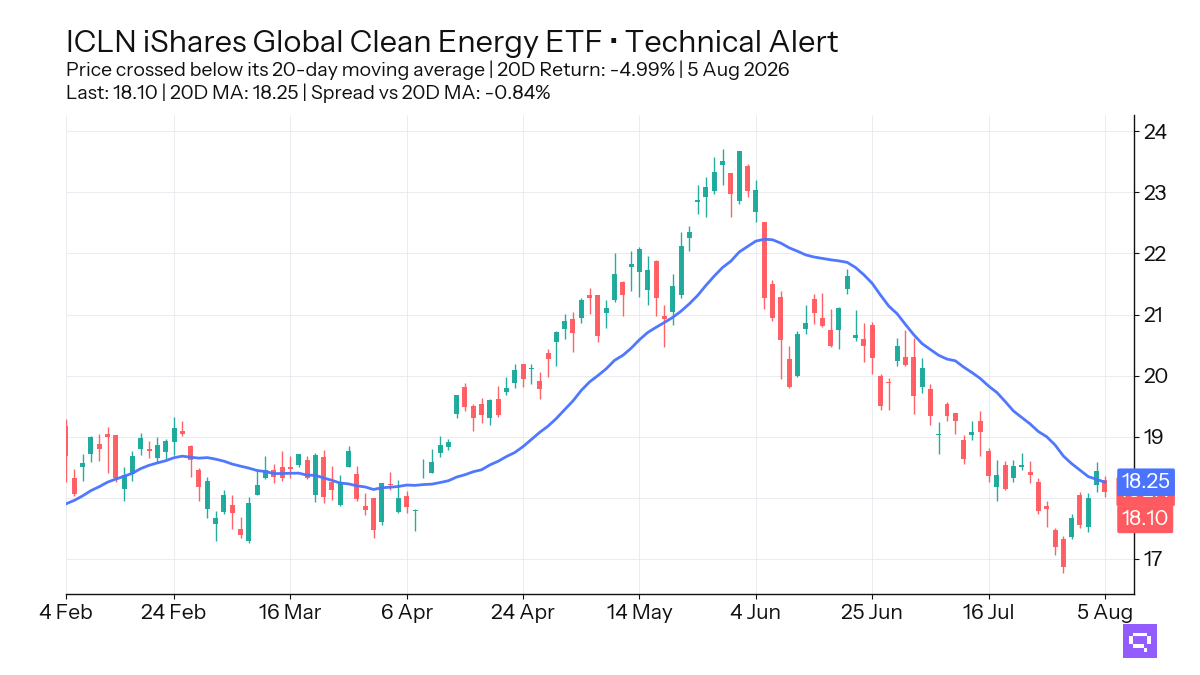
Specialty leadership is limited to gold, gold miners, and infrastructure, with only 3 of 15 ETFs beating the S&P 500 SPY and many equity-linked themes above their 20D MA but below their ratio MA vs SPY. Clean Energy ICLN crossed below its 20D MA, and Silver SLV crossed above its 20D ratio MA vs the S&P 500 SPY. The specialty and commodity mix favors hard assets over equity-sensitive themes.
20-Day Tactical Breadth
Key Takeaways
Materials XLB, Industrials XLI, and Europe VGK joined the daily relative winners versus the S&P 500 SPY, while Nasdaq 100 QQQ and S&P SmallCap Growth SLYG crossed below their 20D ratio MA versus SPY. The equity leadership cluster rotated toward cyclicals and international exposures, and growth beta lost relative ground.
Credit, mortgages, and international aggregate make up the bond relative winners versus the Aggregate Bonds AGG, while long duration and inflation-linked exposure fill the laggard cluster. The fixed-income cross-section rewards spread product and intermediate duration more than duration extension.
Clean Energy ICLN, down 4.99% over the trailing 20-day window, crossed below its 20-day moving average. Gold GLD and Silver SLV crossed above their 20D ratio MA versus the S&P 500 SPY. Global REITs REET crossed above its 20D MA. The specialty and commodity winners cluster in hard assets and real assets.
FEATURED ETF: iShares Global Clean Energy ETF ICLN
Other Technical Signal Events
Equity: Price vs 20-day MA
| Signal | Ticker | Name | 20D perf |
|---|---|---|---|
| Cross-down | XLE | Energy Select Sector | +3.08% |
Equity vs SPY: Price Ratio vs 20-day MA
| Signal | Ticker | Name | 20D rel perf |
|---|---|---|---|
| Cross-up | EWJ | iShares MSCI Japan ETF | -0.43% |
| Cross-up | XLY | Consumer Discretionary Select Sector | -0.36% |
| Cross-up | XLI | Industrial Select Sector | unch. |
| Cross-up | EFA | iShares MSCI EAFE ETF | +0.64% |
| Cross-up | VGK | Vanguard FTSE Europe Index ETF | +0.86% |
| Cross-up | XLB | Materials Select Sector | +1.62% |
| Cross-down | SLYG | SPDR S&P 600 Small Cap Growth ETF | -0.51% |
| Cross-down | QQQ | Invesco QQQ | -2.37% |
Specialty: Price vs 20-day MA
| Signal | Ticker | Name | 20D perf |
|---|---|---|---|
| Cross-up | REET | iShares Global REIT ETF | +2.38% |
| Cross-down | ICLN | iShares Global Clean Energy ETF | -4.99% |
Specialty vs SPY: Price Ratio vs 20-day MA
| Signal | Ticker | Name | 20D rel perf |
|---|---|---|---|
| Cross-up | GLD | SPDR Gold | +0.76% |
Commodities vs SPY: Price Ratio vs 20-day MA
| Signal | Ticker | Name | 20D rel perf |
|---|---|---|---|
| Cross-up | SLV | iShares Silver | +2.77% |
Romain Gandon
CEO, Quantlake
Disclaimer: This article is for informational and educational purposes only and does not constitute investment advice. Past performance is not indicative of future results.