



Tactical Trends: Equity Breakdown Leaves Only 8% Above 20-Day Averages
The 23pp price-relative gap places relative winners below price MAs.
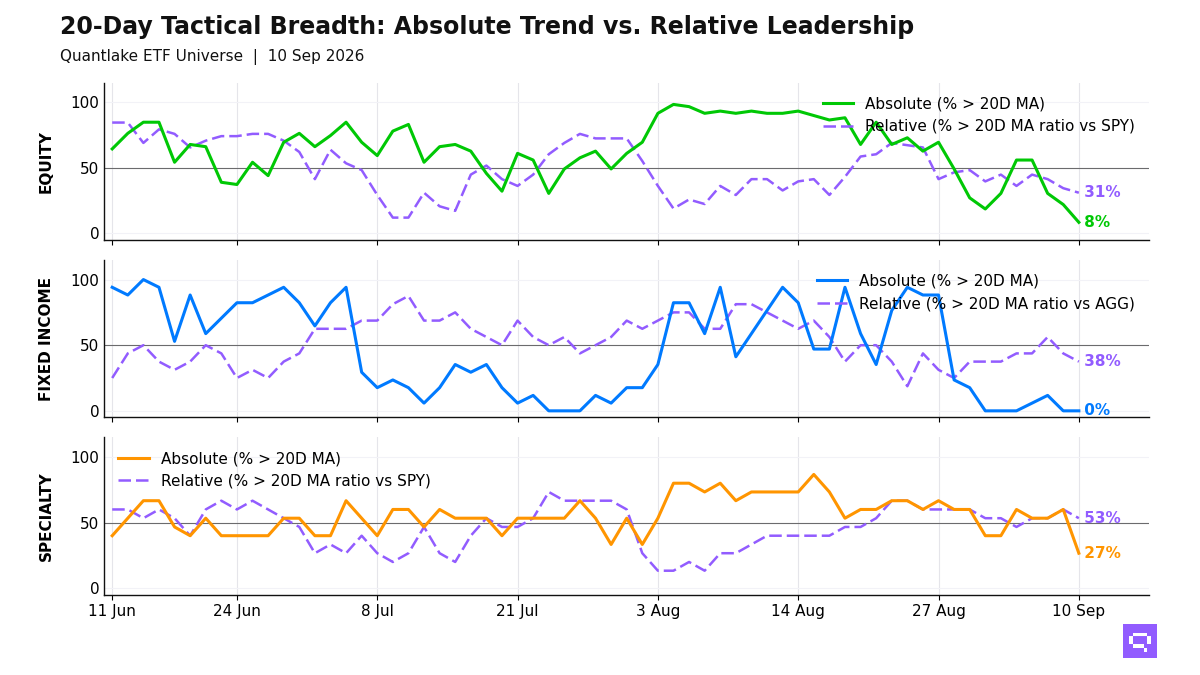
Price damage defined equities at the close on September 10, with 5 of 59 equity ETFs (8%, -13.6pp on the day) above their 20-day moving average (20D MA) and 18 of 58 (31%, -3.5pp) above their ratio MA vs the S&P 500 SPY. Energy and Asia-Pacific equity account for four of those five price leaders. The 23pp negative price-relative gap places emerging markets, growth, and value among the below-MA names that still beat the benchmark. The equity regime is broad bear, and the relative winners cluster below price MAs.
Fixed income shows no absolute strength, with 0 of 17 above their 20D MA and 6 of 16 outperforming the Aggregate Bonds AGG on a ratio basis. High yield, short duration, inflation-linked bonds, and 3-7yr Treasuries IEI hold the relative leaders. Long-duration Treasuries and investment grade lag. The bond profile concentrates in shorter duration and selective credit.
Digital assets, managed futures, and clean energy form the specialty leadership cluster, while Semiconductors SMH trades below its 20D MA. Commodities split between oil and broad commodity strength on the multi-horizon grid and fresh breaks lower in Copper CPER and precious metals. The specialty and commodity mix favors energy-linked inflation exposure.
20-Day Tactical Breadth
Key Takeaways
Communication Services XLC crossed above its ratio MA vs the S&P 500 SPY after a 3.07% 20-day relative gain, even as Technology XLK and US Technology IYW crossed below their price MAs. Broad technology lacks price confirmation, and relative strength concentrates in communications.
3-7yr Treasuries IEI crossed above its ratio MA vs the Aggregate Bonds AGG, while Investment Grade Credit LQD and EM Sovereign Bonds EMB crossed below theirs. High yield, TIPS, and short duration hold the stronger relative cluster, so duration defense and selective credit lead the bond cross-section.
Gold Miners GDX, up 5.57% over the trailing 20-day window, crossed below its 20D MA. GDX also crossed below its ratio MA vs the S&P 500 SPY after a 7.62% relative 20-day gain, and Copper CPER and Silver SLV crossed below their price MAs and ratio MAs vs the S&P 500 SPY. Metals exposure loses both absolute and relative confirmation.
FEATURED ETF: VanEck Gold Miners ETF GDX

Other Technical Signal Events
Equity: Price vs 20-day MA
| Signal | Ticker | Name | 20D perf |
|---|---|---|---|
| Cross-down | IDV | iShares International Select Dividend ETF | +1.02% |
| Cross-down | EEM | iShares MSCI Emerging Markets ETF | +0.81% |
| Cross-down | COPX | Global X Copper Miners ETF | +0.35% |
| Cross-down | VLUE | iShares MSCI USA Value Factor ETF | +0.31% |
| Cross-down | IVLU | iShares Edge MSCI Intl Value Factor ETF | -0.43% |
| Cross-down | VWO | Vanguard FTSE Emerging Markets Index ETF | -0.78% |
| Cross-down | IYW | iShares U.S. Technology ETF | -1.09% |
| Cross-down | XLK | Technology Select Sector | -1.93% |
Equity vs SPY: Price Ratio vs 20-day MA
| Signal | Ticker | Name | 20D rel perf |
|---|---|---|---|
| Cross-up | XLC | Communication Services Select Sector | +3.07% |
| Cross-down | COPX | Global X Copper Miners ETF | +2.29% |
| Cross-down | VT | Vanguard Total World Stock Index ETF | unch. |
| Cross-down | VEA | Vanguard FTSE Developed Markets Index ETF | unch. |
Fixed Income vs AGG: Price Ratio vs 20-day MA
| Signal | Ticker | Name | 20D rel perf |
|---|---|---|---|
| Cross-up | IEI | iShares 3-7 Year Treasury Bond ETF | unch. |
| Cross-down | EMB | iShares J.P. Morgan USD Emerging Markets Bond ETF | -0.11% |
| Cross-down | LQD | iShares iBoxx $ Investment Grade Corporate Bond ETF | -0.17% |
Specialty: Price vs 20-day MA
| Signal | Ticker | Name | 20D perf |
|---|---|---|---|
| Cross-down | GDX | VanEck Gold Miners ETF | +5.57% |
| Cross-down | FTLS | First Trust Long/Short Equity ETF | +0.20% |
| Cross-down | JEPQ | JPMorgan Nasdaq Equity Premium Income ETF | unch. |
| Cross-down | MTUM | iShares MSCI USA Momentum Factor ETF | -3.68% |
| Cross-down | SMH | VanEck Semiconductor ETF | -4.20% |
Specialty vs SPY: Price Ratio vs 20-day MA
| Signal | Ticker | Name | 20D rel perf |
|---|---|---|---|
| Cross-down | GDX | VanEck Gold Miners ETF | +7.62% |
Commodities: Price vs 20-day MA
| Signal | Ticker | Name | 20D perf |
|---|---|---|---|
| Cross-down | CPER | United States Copper LP | -2.45% |
| Cross-down | SLV | iShares Silver | -2.64% |
Commodities vs SPY: Price Ratio vs 20-day MA
| Signal | Ticker | Name | 20D rel perf |
|---|---|---|---|
| Cross-down | CPER | United States Copper LP | -0.56% |
| Cross-down | SLV | iShares Silver | -0.76% |
Romain Gandon
CEO, Quantlake
Disclaimer: This article is for informational and educational purposes only and does not constitute investment advice. Past performance is not indicative of future results.


