.png)
Tactical Trends: Equities Recover Into a Benchmark-Led Session
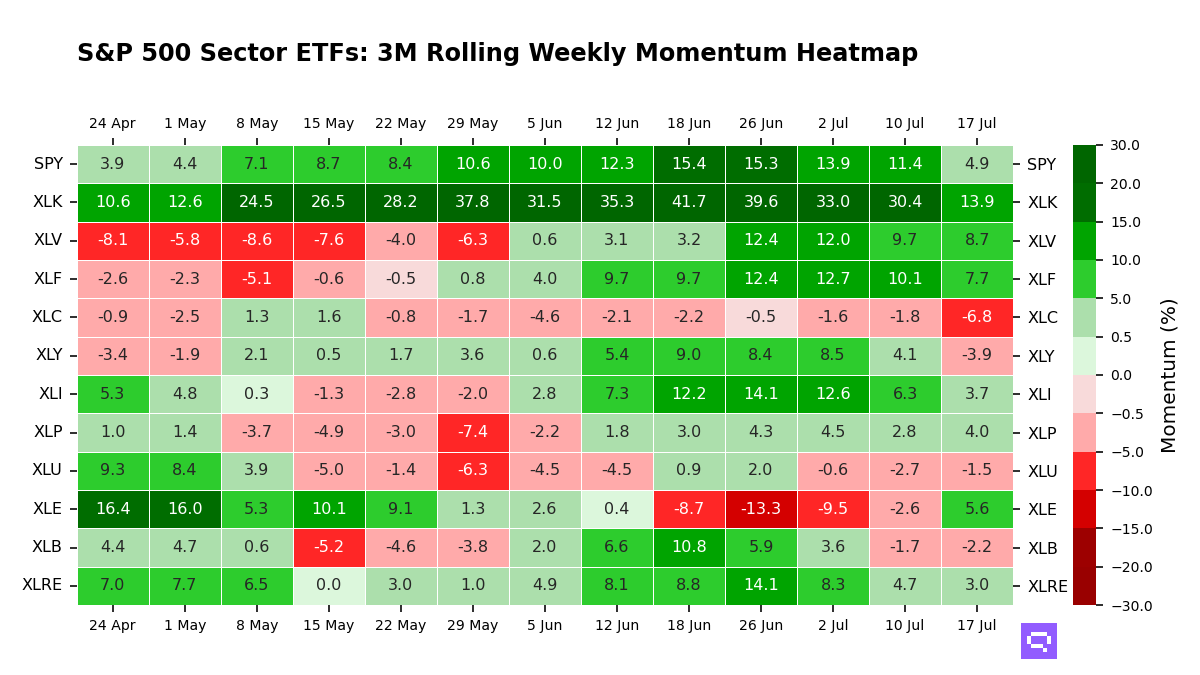
Price breadth rose faster than leadership across our equity coverage
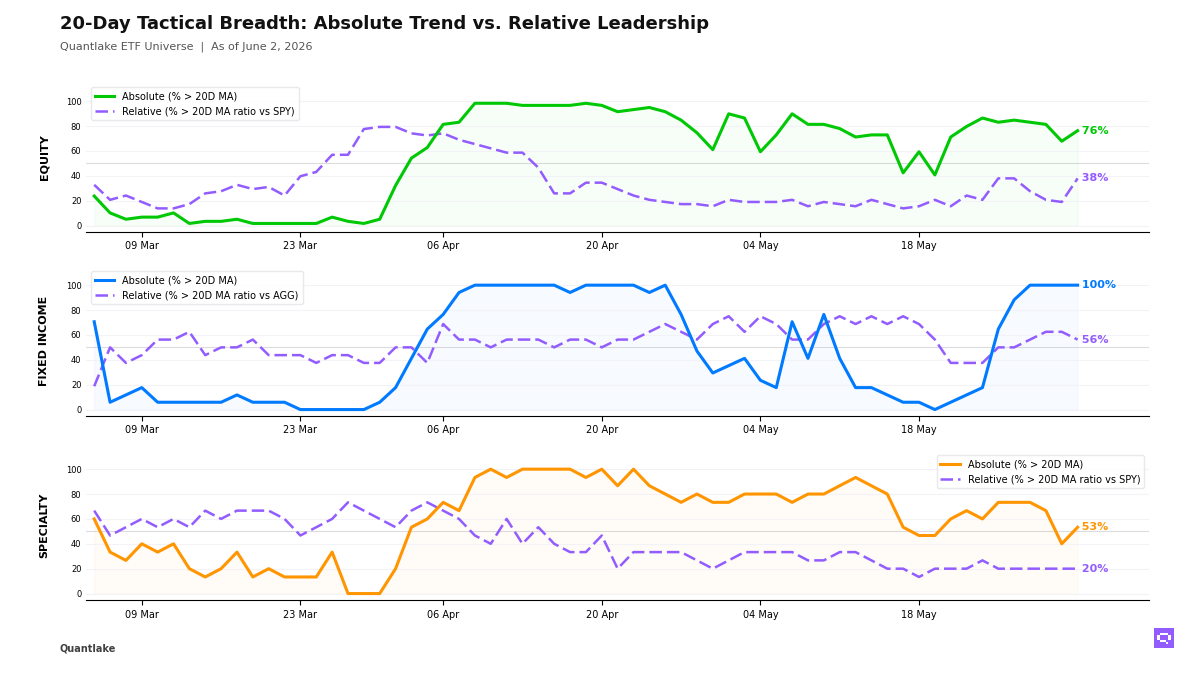
At the close, equities recovered in price faster than leadership recovered. Across our ETF universe, 45 of 59 equity ETFs (76%, +8.5pp) held above their 20-day moving average, but only 22 of 58 (38%, +19.0pp) outperformed the S&P 500 SPY, leaving a +38pp gap. US size rotation, emerging markets and Taiwan drove the relative lift, while low-volatility, developed ex-US factor specialty and several defensive sectors still lagged the benchmark. The equity tape stayed benchmark-led rather than genuinely broad.
Fixed income held a full price base as relative leadership narrowed. 17 of 17 bond ETFs (100%, unchanged on the day) stayed above their 20-day moving average, but only 9 of 16 (56%, -6.2pp) beat the Aggregate Bonds AGG, leaving a +44pp gap. High yield, international aggregate, preferreds and long duration led, while Treasuries, inflation-linked exposure and short duration lost relative ground. Bonds stayed in an internal rotation regime rather than a fresh cross-bucket confirmation.
In specialty, price recovered without broad relative confirmation. 8 of 15 ETFs (53%, +13.3pp) held above their 20-day moving average, but only 3 of 15 (20%, unchanged on the day) outperformed the S&P 500 SPY as semiconductors, momentum and clean energy led and long-short equity, infrastructure and low-volatility equity recovered without beating the benchmark. Commodities added no new confirmed alerts by end of day, and our cross-timescale read still leaves copper as the only aligned leader while agriculture and silver lag on a relative basis. The non-core buckets stayed selective rather than broadening.
20-Day Tactical Breadth
Key Takeaways
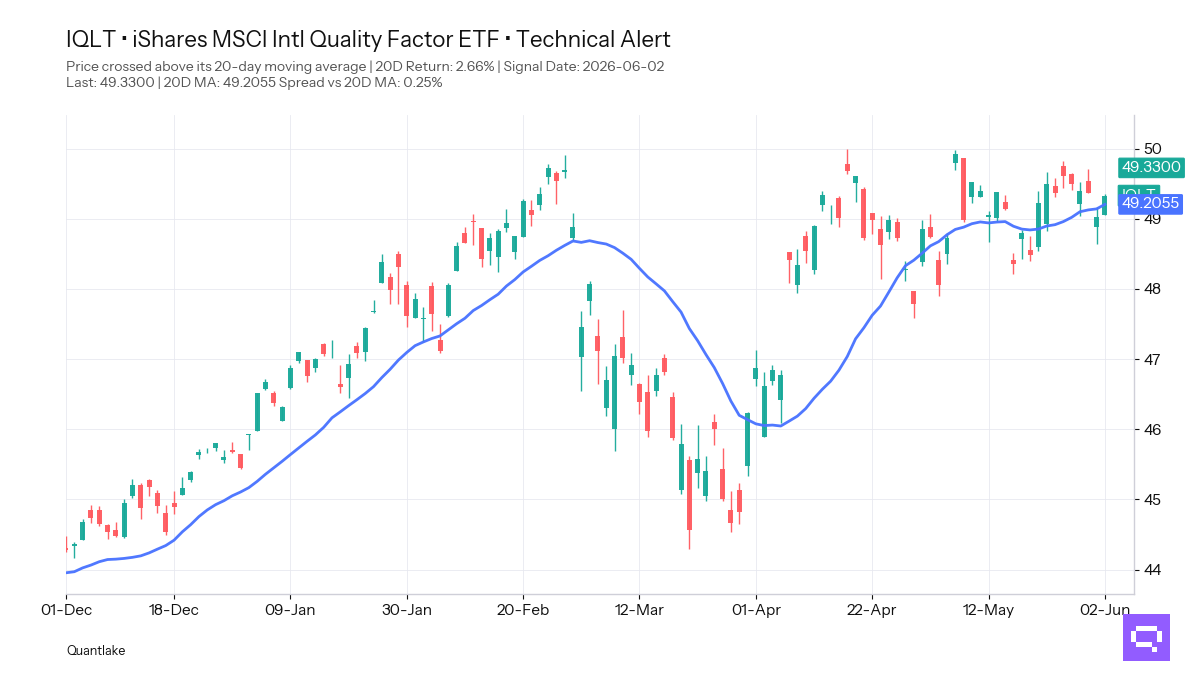
• Intl Quality IQLT with a +2.66% period return crossed above its 20-day moving average. We place that move alongside United Kingdom EWU and China MCHI on the price side. Quality still sits in the relative laggard group versus the S&P 500 SPY, so this remains price repair without relative leadership.
• The equity ratio cluster split between strengthening leadership and early stabilization. Developed Markets VEA and Global Equities VT crossed above their ratio moving average versus the S&P 500 SPY with positive 20-day relative returns. Dow Jones DIA, Russell 2000 IWM, Mid-Cap VO and Emerging Markets VWO also crossed up, but each still carries a negative 20-day relative return, so the relative improvement is recent rather than persistent.
• In fixed income, Corporate Credit VCIT crossed below its ratio moving average versus the Aggregate Bonds AGG. The broader relative split still favors long duration, high yield, preferreds and international aggregate, while intermediate Treasuries and short-duration specialty stay above their own price averages but lag the benchmark. In specialty, Long/Short Equity FTLS and Infrastructure PAVE crossed above their 20-day moving average, yet both remain in the divergent camp versus the S&P 500 SPY. That combination marks price recovery without broad relative confirmation outside core equity.
FEATURED ETF — iShares MSCI Intl Quality Factor ETF IQLT
Other Technical Signal Events
EQUITY
↗ Price breakouts (cross-up 20D MA)
• MCHI - iShares MSCI China ETF · 20D perf: -0.19%
• SDY - SPDR® S&P Dividend ETF · +0.97%
• EWU - iShares MSCI United Kingdom ETF · +1.10%
• XLB - Materials Select Sector · +1.72%
• XLI - Industrial Select Sector · +1.88%
• IQLT - iShares MSCI Intl Quality Factor ETF · +2.66%
↘ Price breakdowns (cross-down 20D MA)
• XLV - Health Care Select Sector · 20D perf: +1.15%
↗ Leadership gains (cross-up 20D MA vs SPY)
• SLYV - SPDR® S&P 600 Small Cap Value ETF · 20D relative perf: -2.14%
• VO - Vanguard Mid-Cap · -2.00%
• VYM - Vanguard High Dividend Yield · -1.86%
• RSP - Invesco S&P 500® Equal Weight ETF · -1.53%
• VWO - Vanguard FTSE Emerging Markets · -1.51%
• VB - Vanguard Small-Cap · -1.50%
• IWM - iShares Russell 2000 ETF · -0.78%
• DIA - SPDR Dow Jones Industrial Average ETF · -0.69%
• MDYG - SPDR® S&P 400 Mid Cap Growth ETF · -0.15%
• VT - Vanguard Total World Stock · unch.
• VEA - Vanguard FTSE Developed Markets · +0.67%
↘ Leadership losses (cross-down 20D MA vs SPY)
None on the close
FIXED INCOME
↗ Price breakouts (cross-up 20D MA)
None on the close
↘ Price breakdowns (cross-down 20D MA)
None on the close
↗ Leadership gains (cross-up 20D MA vs AGG)
None on the close
↘ Leadership losses (cross-down 20D MA vs AGG)
• VCIT - Vanguard Intermediate-Term Corporate Bond · 20D relative perf: unch.
SPECIALTY
↗ Price breakouts (cross-up 20D MA)
• PAVE - Global X U.S. Infrastructure Development ETF · 20D perf: +1.25%
• FTLS - First Trust Long/Short Equity ETF · +1.88%
↘ Price breakdowns (cross-down 20D MA)
None on the close
↗ Leadership gains (cross-up 20D MA vs SPY)
None on the close
↘ Leadership losses (cross-down 20D MA vs SPY)
None on the close
COMMODITIES
No event on the close
Romain Gandon
CEO, Quantlake
Disclaimer: This article is for informational and educational purposes only and does not constitute investment advice. Past performance is not indicative of future results.