.png)

Tactical Trends: Developed Markets Reclaim Relative Ground vs SPY
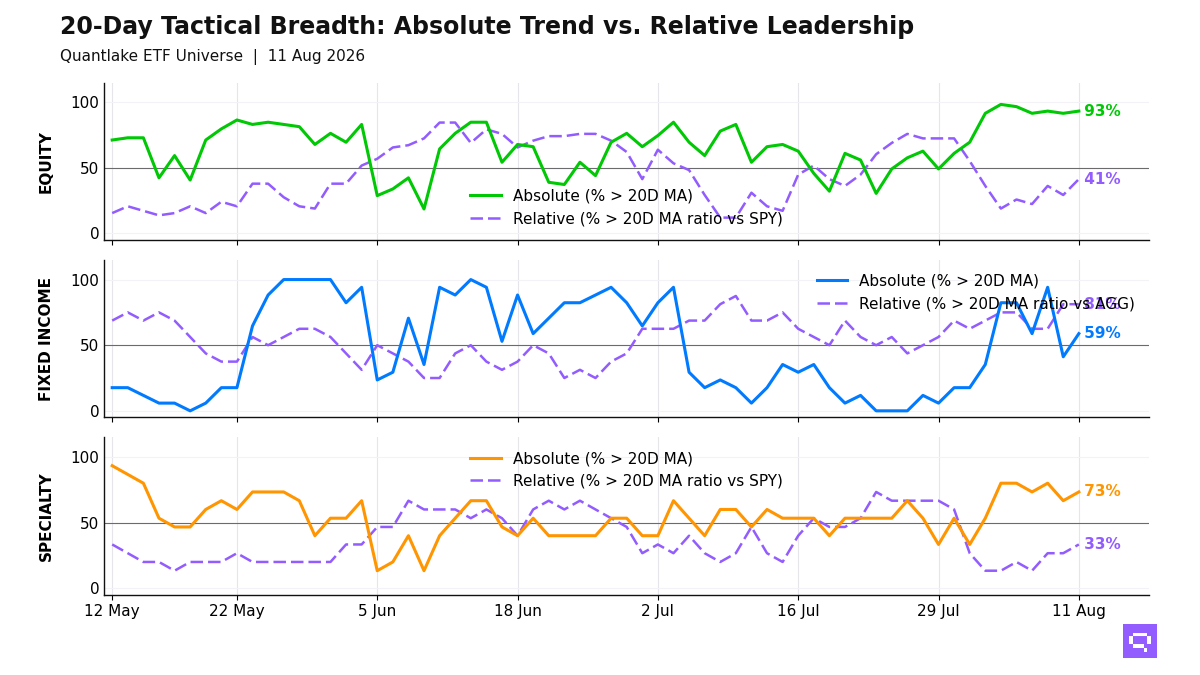
Broad price participation outpaces leadership by 52 points.
Global and developed equity gained ground versus SPY at the close on August 11, with 55 of 59 equity ETFs (93%, +1.7pp) above their 20-day moving average (20D MA) and 24 of 58 (41%, +12.1pp) above their 20-day ratio moving average versus the S&P 500 SPY (20D ratio MA vs SPY). Developed ex-US, world equity, and dividend quality, led by Dev. Markets EFA and Europe VGK, joined the relative winners as relative breadth rose 12.1pp. Low-volatility, emerging markets, and China fill the divergent and laggard clusters. The 52-point price-relative gap narrows, and price participation runs far ahead of benchmark-beating breadth; the configuration is consistent with recovery breadth outrunning confirmed leadership.
Fixed income leadership concentrates in credit and intermediate duration: 13 of 16 bond ETFs beat the Aggregate Bonds AGG, led by high-yield, EM debt, and intermediate Treasuries. Long duration and investment grade lag the benchmark. The bond hierarchy favors lower rate sensitivity over long-duration exposure.
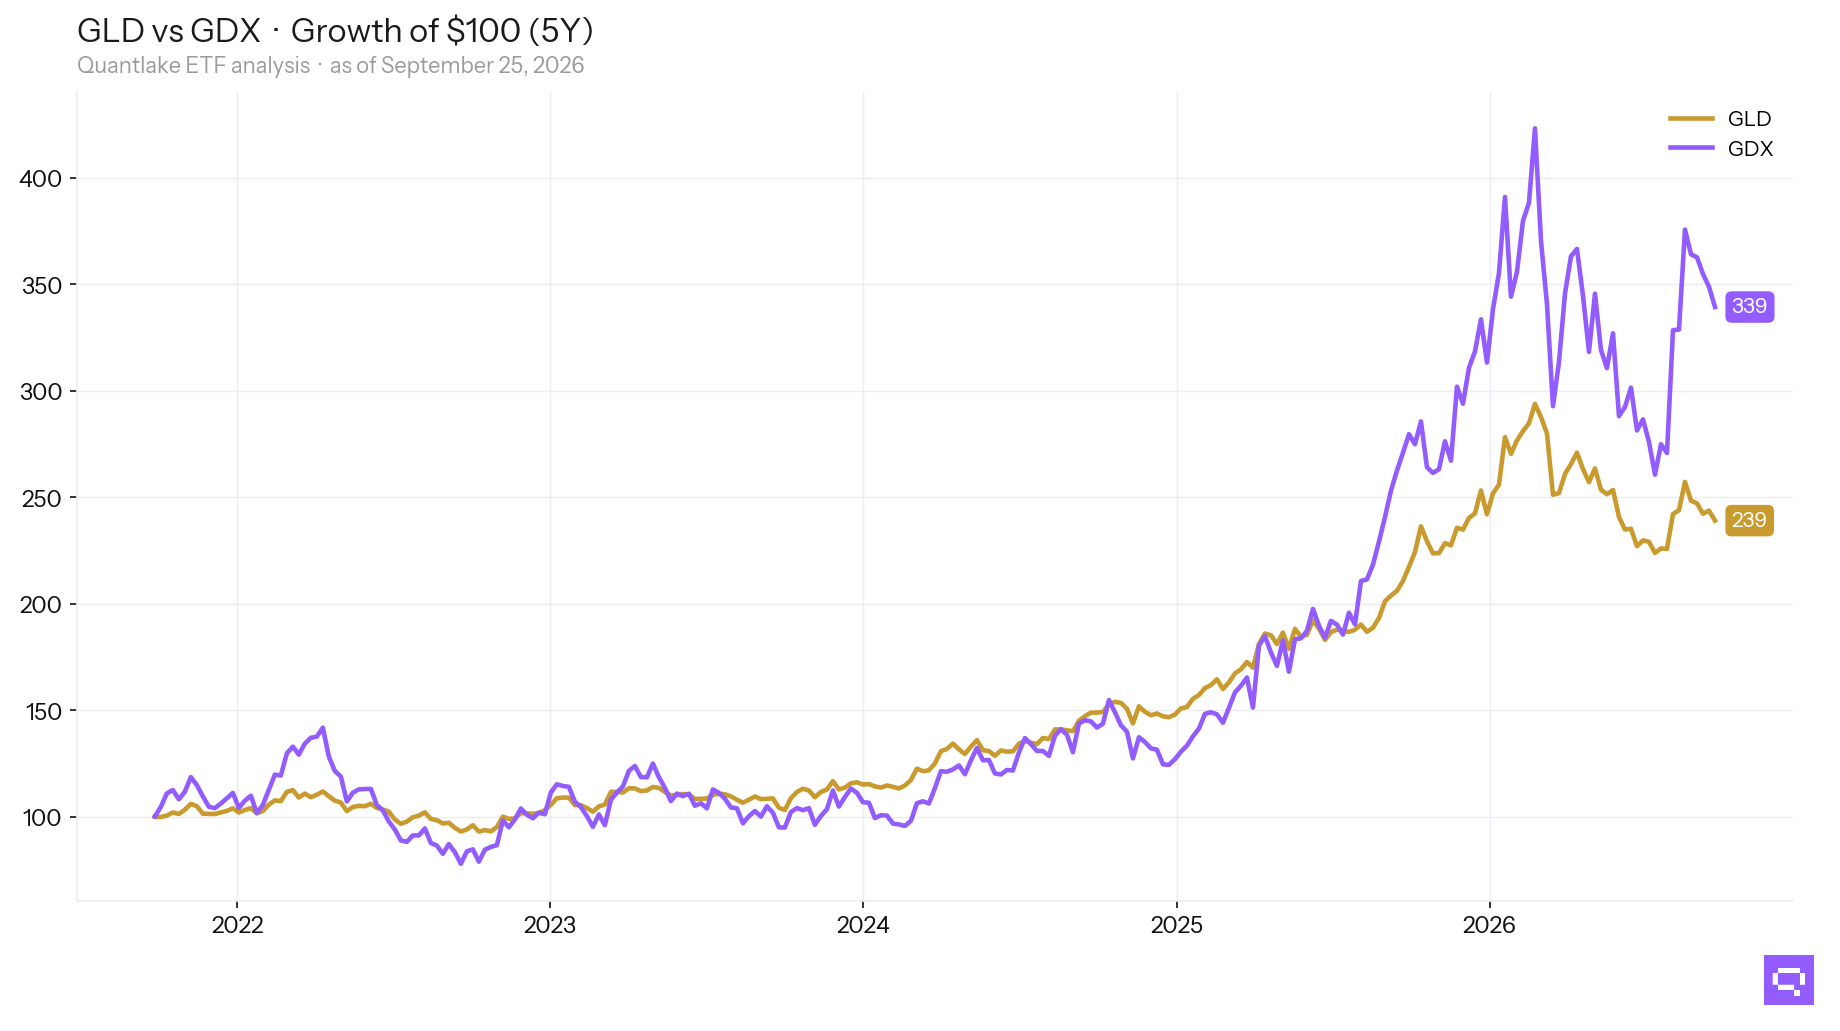
Specialty leadership is selective: gold, gold miners, and Infrastructure PAVE beat the S&P 500 SPY. Clean Energy ICLN and semiconductors hold above their 20D MA and lag the benchmark. Copper and broad commodities crossed above their 20D ratio MA versus the S&P 500 SPY, while agriculture broke below its 20D MA. Non-equity strength concentrates in metals and hard-asset exposure.
20-Day Tactical Breadth
Key Takeaways
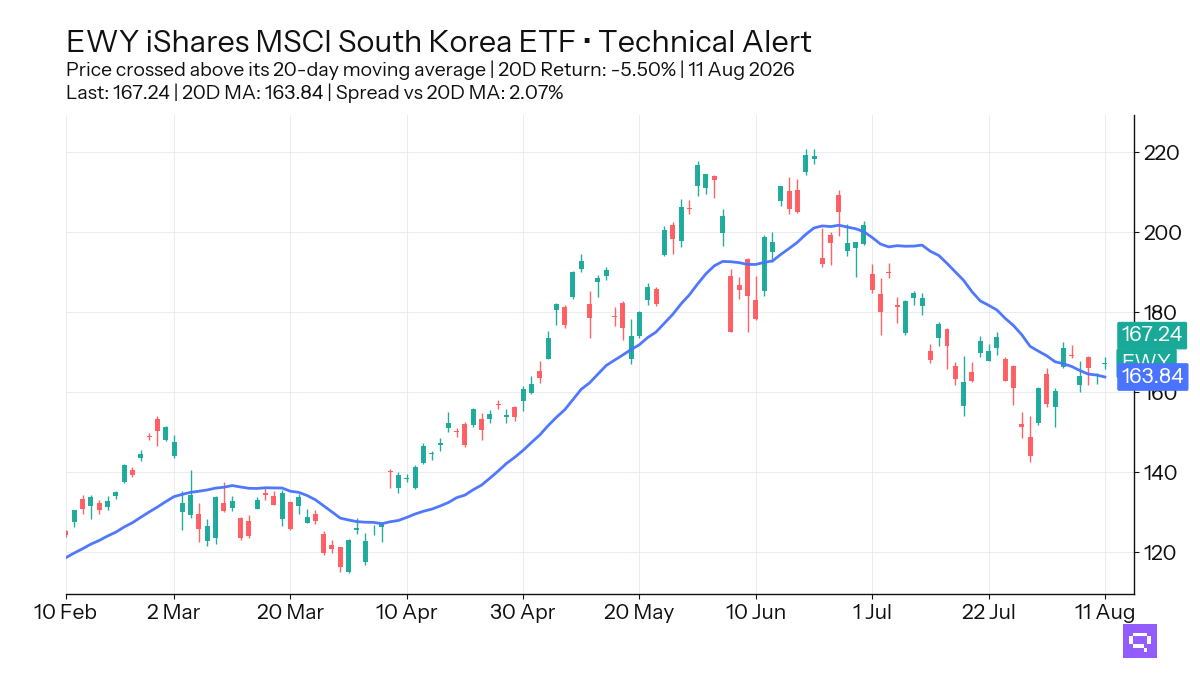
South Korea EWY fell 5.50% over the trailing 20-day window and crossed above its 20-day moving average. Cross-timescale equity alignment reaches 86%, with Germany, Asia-Pacific, and dividend quality in the relative leader set versus the S&P 500 SPY, while emerging markets and UK equity lag across windows. EWY fits the recovery cohort. The equity hierarchy favors developed exposure over EM catch-up.
Cross-timescale fixed-income alignment reaches 71%, with Global Bonds BNDX, 3-7yr Treasuries IEI, and Int. Treasuries VGIT in the leader set versus the Aggregate Bonds AGG, while long-duration Treasuries and investment grade occupy the lagging side. Mortgage-backed, inflation-linked, and intermediate credit also outperform AGG from below their 20D MA. The bond split reflects defensive relative strength inside rate-sensitive segments.
Specialty alignment reaches 53%, with biotechnology the lone cross-timescale relative leader versus the S&P 500 SPY, while Clean Energy ICLN and semiconductors trade above their 20D MA without beating the benchmark. Copper CPER and Broad Commodities PDBC crossed above their 20D ratio MA versus the S&P 500 SPY, while Agriculture Basket DBA crossed below its 20D MA. Non-equity strength concentrates in metals and diversified commodity exposure.
FEATURED ETF: iShares MSCI South Korea ETF EWY
Other Technical Signal Events
Equity: Price vs 20-day MA
| Signal | Ticker | Name | 20D perf |
|---|---|---|---|
| Cross-up | EWY | iShares MSCI South Korea ETF | -5.50% |
Equity vs SPY: Price Ratio vs 20-day MA
| Signal | Ticker | Name | 20D rel perf |
|---|---|---|---|
| Cross-up | QQQ | Invesco QQQ | -2.60% |
| Cross-up | IMTM | iShares MSCI Intl Momentum Factor ETF | -0.43% |
| Cross-up | VT | Vanguard Total World Stock Index ETF | unch. |
| Cross-up | URTH | iShares MSCI World ETF | +0.30% |
| Cross-up | VEA | Vanguard FTSE Developed Markets Index ETF | +0.46% |
| Cross-up | VB | Vanguard Small-Cap Index ETF | +0.62% |
| Cross-up | EFA | iShares MSCI EAFE ETF | +1.45% |
| Cross-up | VGK | Vanguard FTSE Europe Index ETF | +1.99% |
| Cross-up | SCHD | Schwab U.S. Dividend Equity ETF | +3.84% |
| Cross-down | FXI | iShares China Large-Cap ETF | +3.03% |
| Cross-down | MCHI | iShares MSCI China ETF | +1.95% |
Fixed Income: Price vs 20-day MA
| Signal | Ticker | Name | 20D perf |
|---|---|---|---|
| Cross-up | VGIT | Vanguard Intermediate-Term Treasury Index ETF | unch. |
| Cross-up | BNDX | Vanguard Total International Bond Index ETF | unch. |
| Cross-up | IEI | iShares 3-7 Year Treasury Bond ETF | unch. |
Specialty: Price vs 20-day MA
| Signal | Ticker | Name | 20D perf |
|---|---|---|---|
| Cross-up | ICLN | iShares Global Clean Energy ETF | -4.56% |
Specialty vs SPY: Price Ratio vs 20-day MA
| Signal | Ticker | Name | 20D rel perf |
|---|---|---|---|
| Cross-up | PAVE | Global X U.S. Infrastructure Development ETF | +0.99% |
Commodities: Price vs 20-day MA
| Signal | Ticker | Name | 20D perf |
|---|---|---|---|
| Cross-down | DBA | Invesco DB Agriculture | -0.14% |
Commodities vs SPY: Price Ratio vs 20-day MA
| Signal | Ticker | Name | 20D rel perf |
|---|---|---|---|
| Cross-up | CPER | United States Copper LP | +1.82% |
| Cross-up | PDBC | Invesco Optimum Yield Diversified Commodity Strategy No K-1 ETF | +2.31% |
Romain Gandon
CEO, Quantlake
Disclaimer: This article is for informational and educational purposes only and does not constitute investment advice. Past performance is not indicative of future results.