



Tactical Trends: Developed Markets Reclaim Price as US Growth Lags
Relative leadership exceeds price confirmation across our ETF universe.
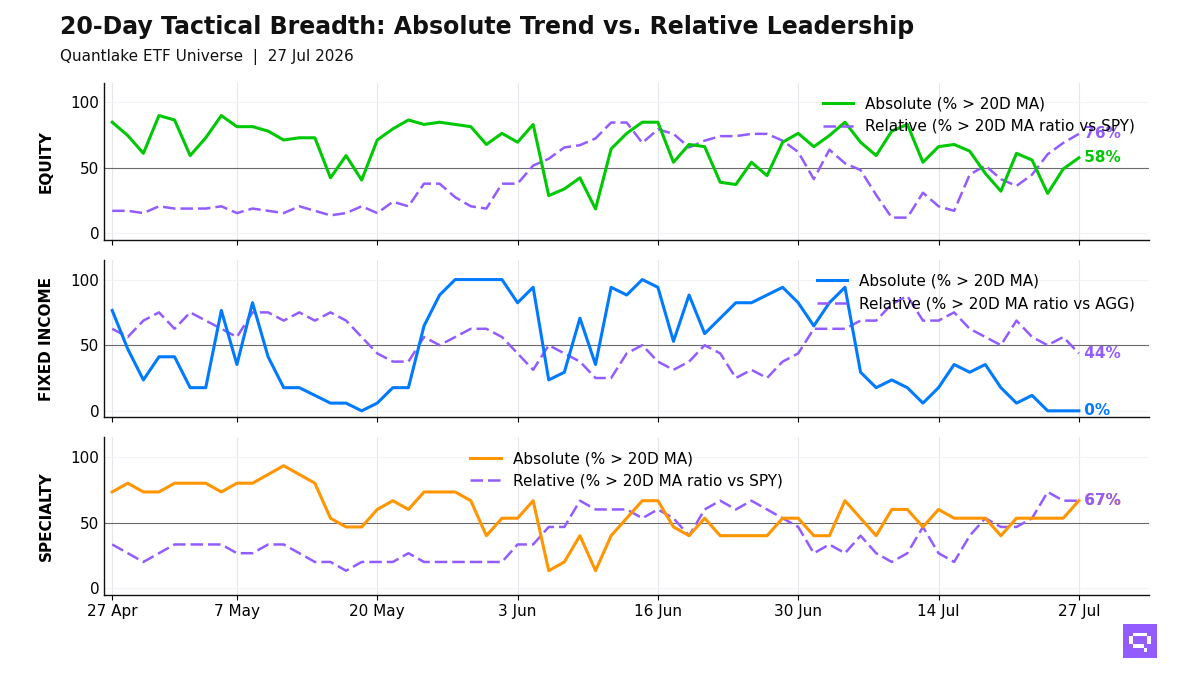
International equity participation improved on July 27. Developed markets EFA and Germany EWG crossed above their 20-day moving average (20D MA) as ex-US and defensive themes strengthened across our ETF universe. In equity, 34 of 59 ETFs (58%, +8.5pp on the day) hold above their 20D MA, and 44 of 58 (76%, +6.9pp) hold above their 20-day ratio moving average vs S&P 500 SPY (20D ratio MA vs SPY). Low volatility, developed ex-US, China, India, and value lead, while US growth, technology, and Taiwan lag the benchmark. Relative leadership exceeds price confirmation, so the equity rebound is broader in relative rotation than in absolute price recovery.
Fixed income offers no price confirmation. At the close, 0 of 17 ETFs stood above their 20D MA. Relative winners vs Aggregate Bonds AGG are limited to Treasuries, mortgages, international aggregate, and short duration, while high yield, investment grade credit, preferreds, and long duration lag. Bond leadership favors stability and rate shelter over credit beta.
Specialty participation is stronger, with 10 of 15 ETFs above both their 20D MA and their 20D ratio MA vs S&P 500 SPY. Gold, managed futures, real estate, and low volatility lead. Gold GLD crossed above its 20D MA, and broad commodities PDBC aligns with copper on the multi-horizon leader side while silver lags. The specialty and commodity mix favors hard assets and defensive equity expressions.
20-Day Tactical Breadth
Key Takeaways
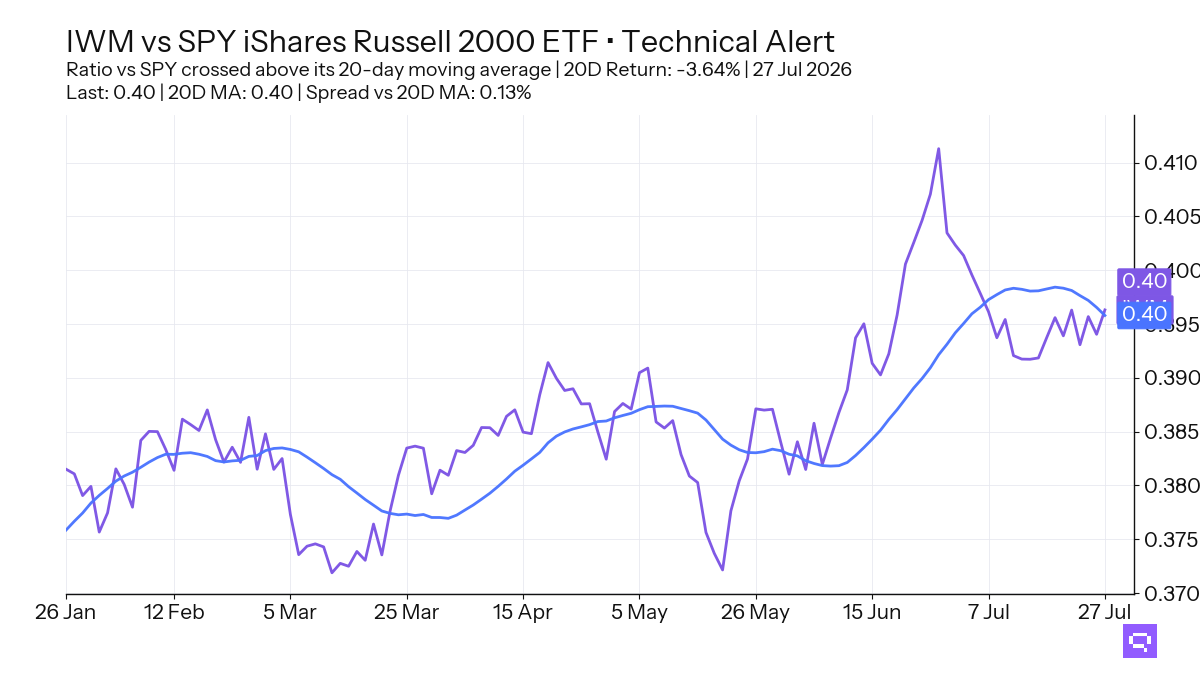
Small-cap IWM, down 3.64% relative to SPY over the trailing 20-day window, crossed above its 20-day ratio moving average. S&P SmallCap Growth SLYG also crossed above its 20-day ratio moving average versus SPY, and five equity divergence names that trade below their 20-day moving average but beat the benchmark cluster in small and mid caps. Relative improvement appears first in lagging size exposures.
7-10 year Treasuries IEF crossed above its 20-day ratio moving average versus Aggregate Bonds AGG. High Yield HYG, High Yield Bonds JNK, and TIPS TIP crossed below their 20-day ratio moving average versus AGG. The bond cross-section separates duration shelter from credit-sensitive laggards.
Managed Futures DBMF, Infrastructure PAVE, and Intl Real Estate REET align across daily, weekly, and monthly price and relative signals, while Semiconductors SMH and clean energy ICLN fill the specialty laggard cluster. Specialty alignment is 47%. Alternative leadership is selective and concentrated in real assets and defensive equity exposure.
FEATURED ETF: iShares Russell 2000 ETF IWM vs SPY
Other Technical Signal Events
Equity: Price vs 20-day MA
| Signal | Ticker | Name | 20D perf |
|---|---|---|---|
| Cross-up | INDA | iShares MSCI India ETF | -1.35% |
| Cross-up | XLP | Consumer Staples Select Sector | +0.77% |
| Cross-up | EFA | iShares MSCI EAFE ETF | +1.34% |
| Cross-up | VGK | Vanguard FTSE Europe Index ETF | +1.96% |
| Cross-up | EWG | iShares MSCI Germany ETF | +2.83% |
Equity vs SPY: Price Ratio vs 20-day MA
| Signal | Ticker | Name | 20D rel perf |
|---|---|---|---|
| Cross-up | IWM | iShares Russell 2000 ETF | -3.64% |
| Cross-up | SLYG | SPDR S&P 600 Small Cap Growth ETF | -3.45% |
| Cross-up | INDA | iShares MSCI India ETF | -2.70% |
| Cross-up | VEA | Vanguard FTSE Developed Markets Index ETF | -2.15% |
| Cross-up | VT | Vanguard Total World Stock Index ETF | -1.05% |
| Cross-down | IMTM | iShares MSCI Intl Momentum Factor ETF | -2.44% |
Fixed Income vs AGG: Price Ratio vs 20-day MA
| Signal | Ticker | Name | 20D rel perf |
|---|---|---|---|
| Cross-up | IEF | iShares 7-10 Year Treasury Bond ETF | -0.19% |
| Cross-down | JNK | SPDR Bloomberg High Yield Bond ETF | +1.11% |
| Cross-down | HYG | iShares iBoxx $ High Yield Corporate Bond ETF | +1.10% |
| Cross-down | TIP | iShares TIPS Bond ETF | +0.18% |
Specialty: Price vs 20-day MA
| Signal | Ticker | Name | 20D perf |
|---|---|---|---|
| Cross-up | GLD | SPDR Gold | +0.27% |
| Cross-up | USMV | iShares MSCI USA Min Vol Factor ETF | +1.63% |
Romain Gandon
CEO, Quantlake
Disclaimer: This article is for informational and educational purposes only and does not constitute investment advice. Past performance is not indicative of future results.


