.png)

Tactical Trends: Defensive Rotation Broadens as Growth and Tech Crack
Relative leadership shifts to dividends, value and low volatility.
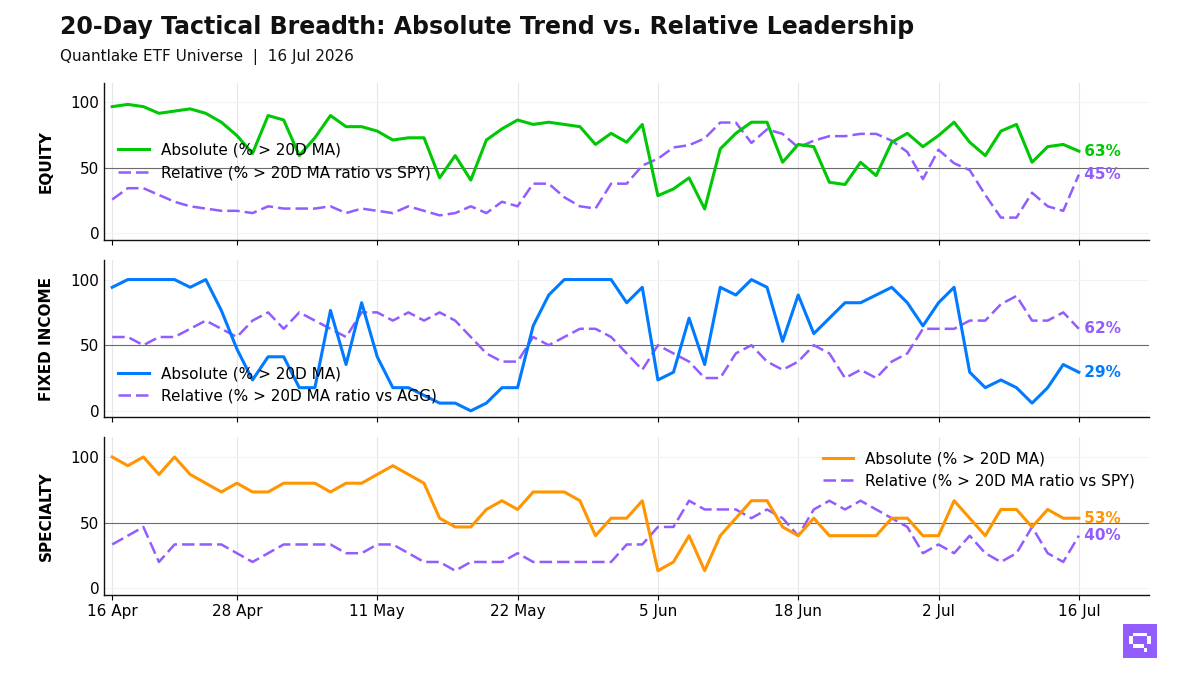
Dividend, value, and low-volatility leadership defines our ETF universe at the close on July 16, with 37 of 59 equity ETFs (63%, -5.1pp) above their 20-day moving average (20D MA) and 26 of 58 (45%, +27.6pp) above their 20-day ratio moving average versus the S&P 500 SPY (20D ratio MA vs SPY). Equity accounts for 17 of the 23 ratio signals, clustered in equal weight and defensive sectors, while growth, technology, and Asia-Pacific exposures fill the laggard cluster. The configuration points to a less benchmark-concentrated advance, and cyclical confirmation is limited.
Fixed income splits between limited price confirmation and broad benchmark outperformance: 10 of 16 bond ETFs beat the Aggregate Bonds AGG, led by high-yield credit, short duration, and intermediate Treasuries, while EM debt, preferreds, and long duration lag. Only 5 of 17 hold above their 20D MA. Bond leadership clusters in stability, intermediate duration, and higher-coupon credit.
Specialty leadership is selective: 6 of 15 specialty ETFs beat the S&P 500 SPY, led by managed futures, real estate, and biotech, while clean energy, momentum, and semiconductors lag. Commodities add copper and agriculture on the leader side, and silver anchors the laggard set. Non-core strength concentrates in diversifiers, property, and industrial-input commodities.
20-Day Tactical Breadth
Key Takeaways
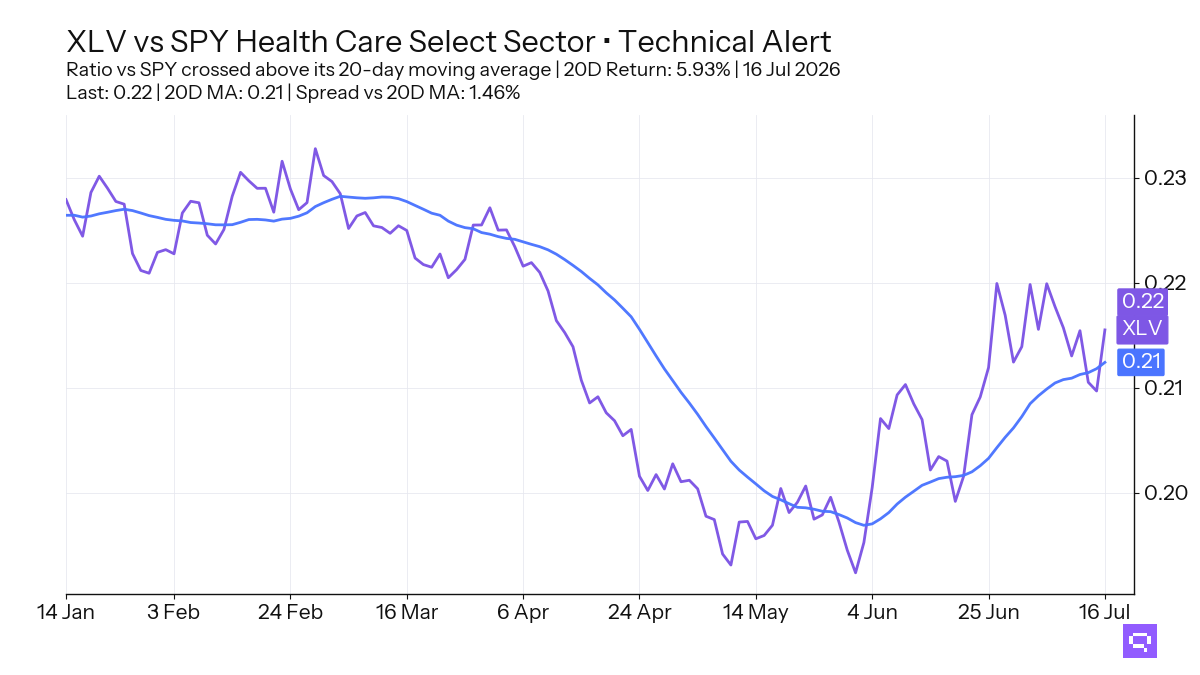
Relative leadership versus the S&P 500 SPY spread across defensive sectors and factor groups. Healthcare XLV, up 5.93% relative to SPY over the trailing 20-day window, crossed above its 20-day ratio moving average. Dividend Quality SCHD, Quality Factor QUAL, and Equal Weight S&P 500 RSP already align on the daily, weekly, and monthly relative leader lists. The rotation reaches across sector, factor, and breadth proxies.
Intermediate Treasuries VGIT and 7-10 Year Treasuries IEF outperform the Aggregate Bonds AGG even below their 20-day ratio moving average. Mortgages and TIPS show the same defensive relative pattern. EM Sovereign Bonds EMB and Preferred Stock PFF crossed below their 20-day ratio moving average versus AGG. The bond split places relative leadership in intermediate duration, mortgages, and selected credit.
Managed Futures DBMF and Global REITs REET crossed above their 20-day ratio moving average versus the S&P 500 SPY, and Real Estate VNQ joins the multi-horizon relative leader cluster. Precious metals and clean energy occupy the specialty laggard side, and silver is the commodity laggard across timescales. Non-equity leadership centers on diversifiers, real estate, and industrial-input commodities.
FEATURED ETF: Health Care Select Sector XLV vs SPY
Other Technical Signal Events
Equity: Price vs 20-day MA
| Signal | Ticker | Name | 20D perf |
|---|---|---|---|
| Cross-up | XLP | Consumer Staples Select Sector | +0.96% |
| Cross-up | XLU | Utilities Select Sector | +1.55% |
| Cross-up | SDY | SPDR S&P Dividend ETF | +2.59% |
| Cross-down | SLYG | SPDR S&P 600 Small Cap Growth ETF | +2.83% |
| Cross-down | VT | Vanguard Total World Stock Index ETF | -0.82% |
| Cross-down | EWG | iShares MSCI Germany ETF | -1.27% |
| Cross-down | IWF | iShares Russell 1000 Growth ETF | -1.74% |
| Cross-down | VWO | Vanguard FTSE Emerging Markets Index ETF | -2.08% |
| Cross-down | IYW | iShares U.S. Technology ETF | -2.16% |
Equity vs SPY: Price Ratio vs 20-day MA
| Signal | Ticker | Name | 20D rel perf |
|---|---|---|---|
| Cross-up | XLY | Consumer Discretionary Select Sector | -1.05% |
| Cross-up | ACWV | iShares MSCI Global Min Vol Factor ETF | +0.50% |
| Cross-up | VYM | Vanguard High Dividend Yield Index ETF | +0.58% |
| Cross-up | XLP | Consumer Staples Select Sector | +0.65% |
| Cross-up | EWU | iShares MSCI United Kingdom ETF | +0.68% |
| Cross-up | QUAL | iShares MSCI USA Quality Factor ETF | +1.02% |
| Cross-up | VIG | Vanguard Dividend Appreciation Index ETF | +1.10% |
| Cross-up | JEPI | JPMorgan Equity Premium Income ETF | +1.14% |
| Cross-up | SPYV | S&P 500 Value ETF | +1.19% |
| Cross-up | XLRE | The Real Estate Select Sector | +1.36% |
| Cross-up | RSP | Invesco S&P 500 Equal Weight ETF | +1.44% |
| Cross-up | MDYV | SPDR S&P 400 Mid Cap Value ETF | +1.82% |
| Cross-up | SCHD | Schwab U.S. Dividend Equity ETF | +2.06% |
| Cross-up | SDY | SPDR S&P Dividend ETF | +2.27% |
| Cross-up | IJR | iShares Core S&P Small-Cap ETF | +2.86% |
| Cross-up | SLYV | SPDR S&P 600 Small Cap Value ETF | +2.99% |
| Cross-up | XLV | Health Care Select Sector | +5.93% |
| Cross-down | SPYG | S&P 500 Growth ETF | -0.96% |
Fixed Income: Price vs 20-day MA
| Signal | Ticker | Name | 20D perf |
|---|---|---|---|
| Cross-down | PFF | iShares Preferred and Income Securities ETF | -2.17% |
Fixed Income vs AGG: Price Ratio vs 20-day MA
| Signal | Ticker | Name | 20D rel perf |
|---|---|---|---|
| Cross-down | EMB | iShares J.P. Morgan USD Emerging Markets Bond ETF | -0.19% |
| Cross-down | PFF | iShares Preferred and Income Securities ETF | -1.67% |
Specialty: Price vs 20-day MA
| Signal | Ticker | Name | 20D perf |
|---|---|---|---|
| Cross-up | USMV | iShares MSCI USA Min Vol Factor ETF | +1.27% |
| Cross-down | JEPQ | JPMorgan Nasdaq Equity Premium Income ETF | -1.48% |
Specialty vs SPY: Price Ratio vs 20-day MA
| Signal | Ticker | Name | 20D rel perf |
|---|---|---|---|
| Cross-up | DBMF | iMGP DBi Managed Futures Strategy ETF | +1.02% |
| Cross-up | VNQ | Vanguard Real Estate Index ETF | +2.63% |
| Cross-up | REET | iShares Global REIT ETF | +2.83% |
Romain Gandon
CEO, Quantlake
Disclaimer: This article is for informational and educational purposes only and does not constitute investment advice. Past performance is not indicative of future results.