.png)

Tactical Trends: Defensive Equity Leads as Global Beta Loses Ground
A 57pp price-relative gap makes equity leadership selective.
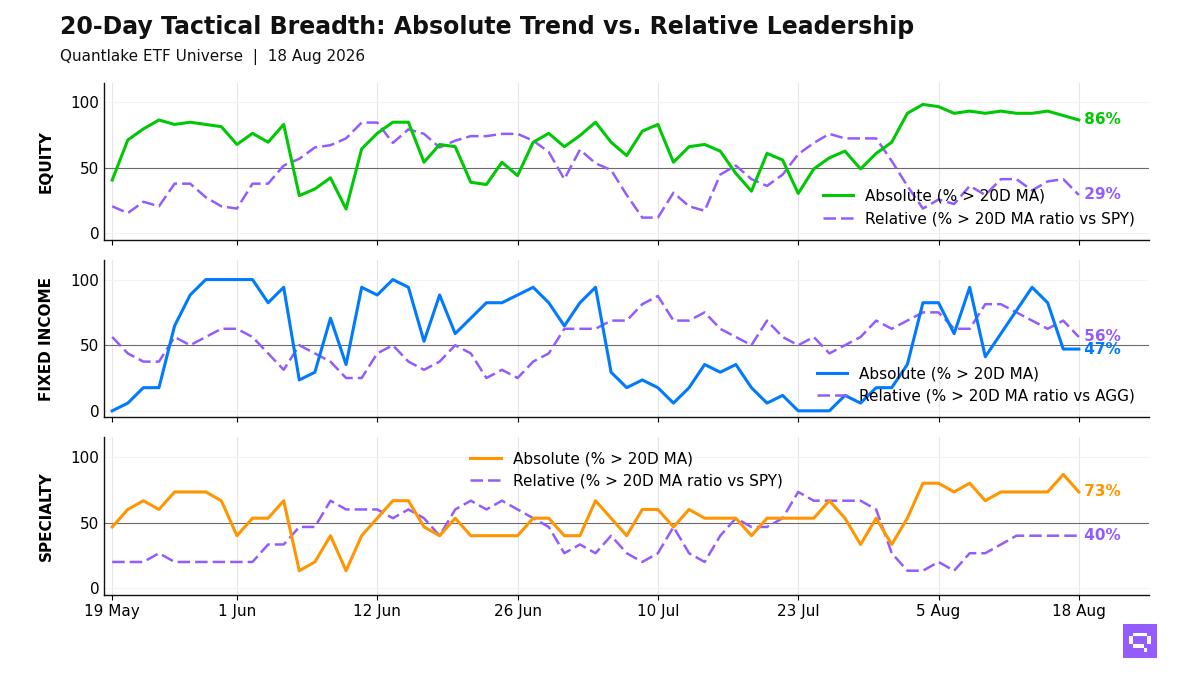
Healthcare and dividend funds led the equity rotation at the August 18 close, with 51 of 59 ETFs (86%, -3.4pp) above their 20-day moving average (20D MA) and only 17 of 58 (29%, -12.1pp) above their 20-day ratio moving average vs S&P 500 SPY (20D ratio MA vs SPY). Emerging markets EEM, developed ex-US exposure, and small caps fill the laggard cluster, even with many of those names above their 20D MAs. The equity configuration is broad in price and selective in leadership.
High-yield credit, short duration, and inflation-linked exposure lead fixed income, with 9 of 16 ETFs outperforming the Aggregate Bonds AGG. Long-duration Treasury TLT and investment-grade credit lag, and Treasury IEF outperforms the benchmark from below its 20D MA. The bond cross-section favors lower rate sensitivity.
Gold, gold miners, biotech, and low-volatility lead specialty, with 11 of 15 ETFs (73%) above their 20D MA. Semiconductors SMH and crypto proxies hold above price but lag the S&P 500 SPY. Broad commodities and oil lead the commodity bucket, and Copper CPER crossed below its 20D MA. Specialty and commodity leadership clusters in hard assets and defensive equity proxies.
20-Day Tactical Breadth
Key Takeaways
Dividend Quality SCHD and Healthcare XLV crossed above their 20D ratio MAs versus S&P 500 SPY, and Select Dividend DVY did the same from a stabilizing base. Cross-timescale alignment is 83% in equity. Dividend equity, energy, and healthcare sit in the relative leader cluster, while emerging markets and developed ex-US exposure sit in the aligned laggard bucket. The leadership stack is strongest in lower-volatility U.S. themes.
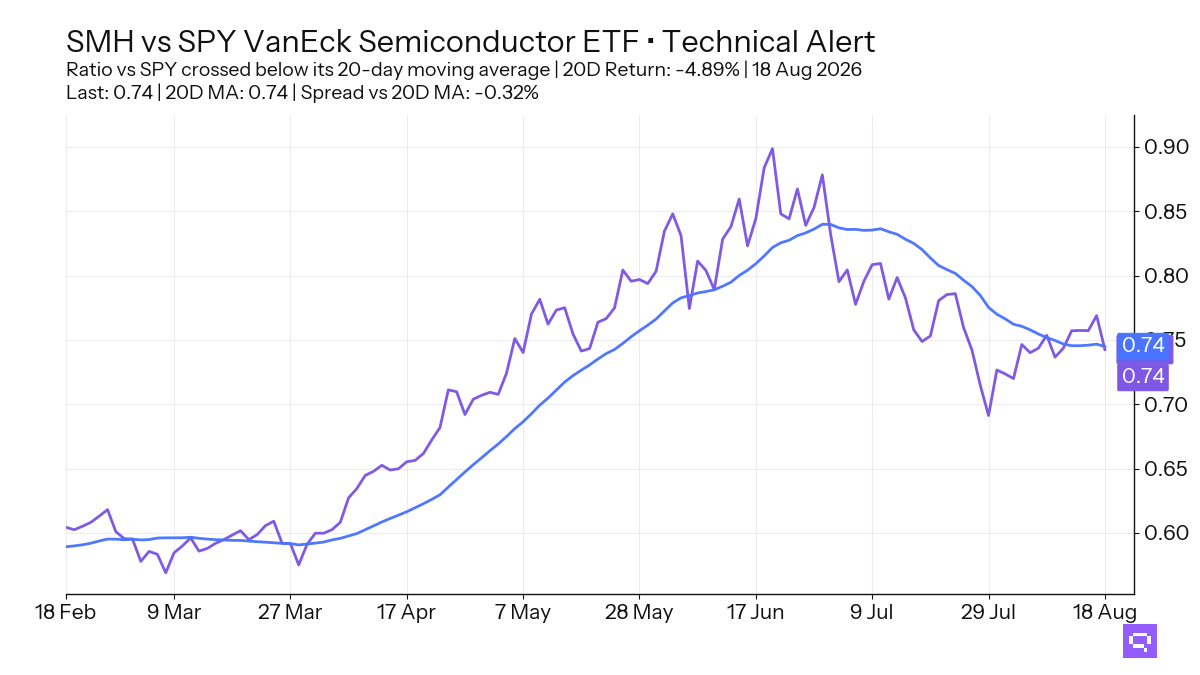
Semiconductors SMH, down 4.89% relative to SPY over the trailing 20-day window, crossed below its 20-day ratio moving average versus S&P 500 SPY. Specialty cross-timescale alignment is 47%. Biotech IBB is the only relative leader aligned across daily, weekly, and monthly measures. The specialty bucket separates aligned hard-asset and defensive leadership from price-above, benchmark-lagging names.
TIPS TIP crossed above its 20D MA and its 20D ratio MA versus Aggregate Bonds AGG, while Muni Bonds MUB and EM Sovereign Bonds EMB crossed below their 20D ratio MAs versus AGG. Cross-timescale alignment is 65% in fixed income. High-yield credit and short duration sit on the strong side. The fixed income split runs between stability-led winners and rate-sensitive laggards.
FEATURED ETF: VanEck Semiconductor ETF SMH vs SPY
Other Technical Signal Events
Equity: Price vs 20-day MA
| Signal | Ticker | Name | 20D perf |
|---|---|---|---|
| Cross-up | XLP | Consumer Staples Select Sector | +1.81% |
| Cross-down | XLB | Materials Select Sector | +3.35% |
| Cross-down | INDA | iShares MSCI India ETF | +1.23% |
| Cross-down | MDYV | SPDR S&P 400 Mid Cap Value ETF | +1.03% |
Equity vs SPY: Price Ratio vs 20-day MA
| Signal | Ticker | Name | 20D rel perf |
|---|---|---|---|
| Cross-up | DVY | iShares Select Dividend ETF | unch. |
| Cross-up | SCHD | Schwab U.S. Dividend Equity ETF | +2.52% |
| Cross-up | XLV | Health Care Select Sector | +3.27% |
| Cross-down | IQLT | iShares MSCI Intl Quality Factor ETF | +0.80% |
| Cross-down | VO | Vanguard Mid-Cap Index ETF | +0.70% |
| Cross-down | EFA | iShares MSCI EAFE ETF | +0.51% |
| Cross-down | EWJ | iShares MSCI Japan ETF | +0.27% |
| Cross-down | URTH | iShares MSCI World ETF | +0.19% |
| Cross-down | VEA | Vanguard FTSE Developed Markets Index ETF | +0.16% |
| Cross-down | VT | Vanguard Total World Stock Index ETF | unch. |
| Cross-down | VB | Vanguard Small-Cap Index ETF | -0.32% |
| Cross-down | IWM | iShares Russell 2000 ETF | -1.28% |
| Cross-down | EEM | iShares MSCI Emerging Markets ETF | -2.50% |
Fixed Income: Price vs 20-day MA
| Signal | Ticker | Name | 20D perf |
|---|---|---|---|
| Cross-up | TIP | iShares TIPS Bond ETF | unch. |
| Cross-down | PFF | iShares Preferred and Income Securities ETF | +0.90% |
Fixed Income vs AGG: Price Ratio vs 20-day MA
| Signal | Ticker | Name | 20D rel perf |
|---|---|---|---|
| Cross-up | TIP | iShares TIPS Bond ETF | unch. |
| Cross-down | PFF | iShares Preferred and Income Securities ETF | +0.95% |
| Cross-down | EMB | iShares J.P. Morgan USD Emerging Markets Bond ETF | -0.29% |
| Cross-down | MUB | iShares National Muni Bond ETF | -0.43% |
Specialty: Price vs 20-day MA
| Signal | Ticker | Name | 20D perf |
|---|---|---|---|
| Cross-down | PAVE | Global X U.S. Infrastructure Development ETF | +1.98% |
| Cross-down | ICLN | iShares Global Clean Energy ETF | -4.21% |
Specialty vs SPY: Price Ratio vs 20-day MA
| Signal | Ticker | Name | 20D rel perf |
|---|---|---|---|
| Cross-up | USMV | iShares MSCI USA Min Vol Factor ETF | +1.51% |
| Cross-down | SMH | VanEck Semiconductor ETF | -4.89% |
Commodities: Price vs 20-day MA
| Signal | Ticker | Name | 20D perf |
|---|---|---|---|
| Cross-down | CPER | United States Copper LP | -0.89% |
Romain Gandon
CEO, Quantlake
Disclaimer: This article is for informational and educational purposes only and does not constitute investment advice. Past performance is not indicative of future results.