.png)

Tactical Trends: Equity Tape Holds, Leadership Stays Narrow
Price recovery is spreading faster than relative confirmation
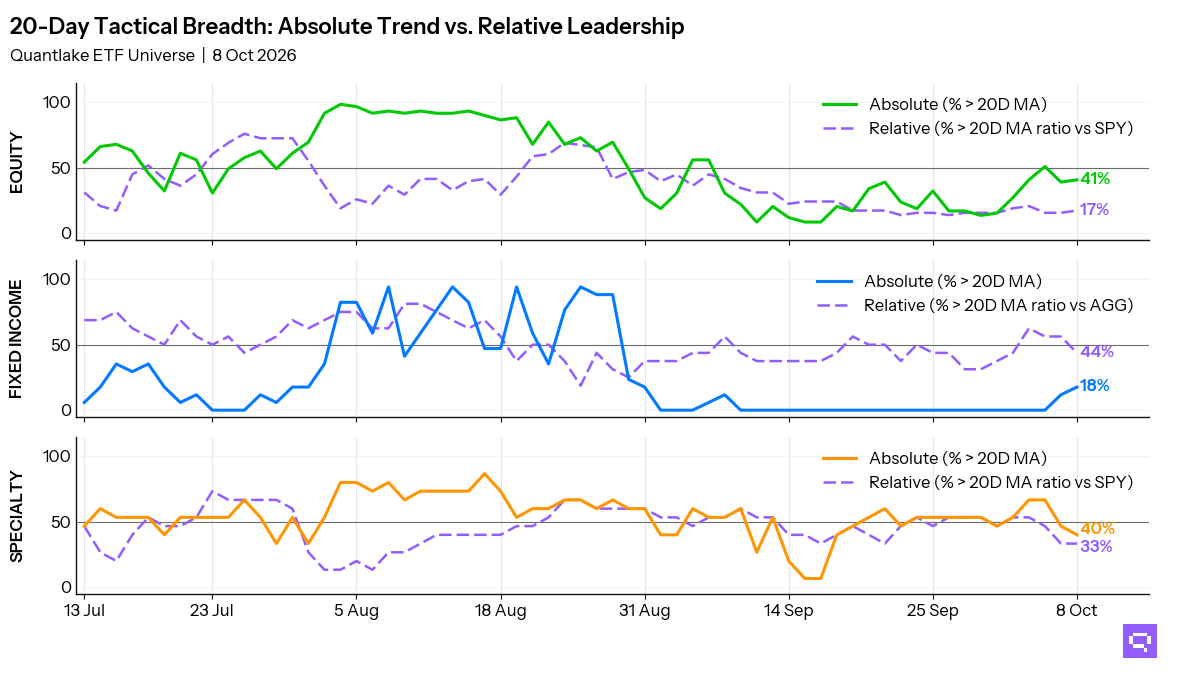
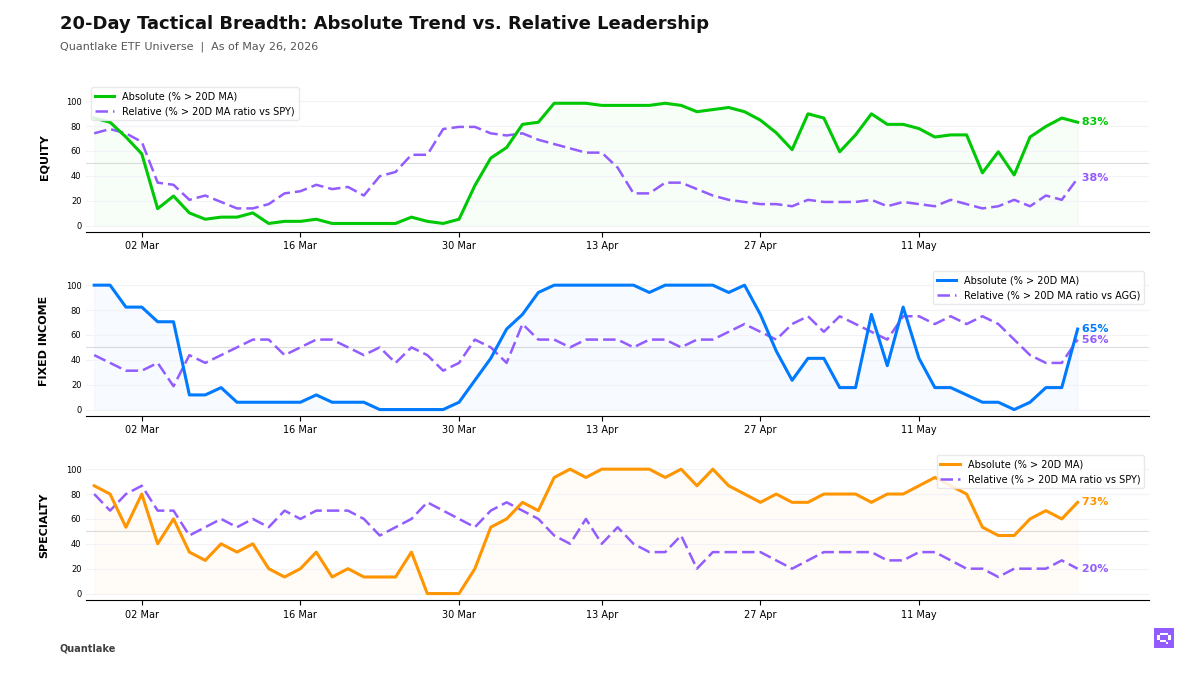
Across our ETF universe at the close, equity stayed benchmark-led rather than broadly confirmed. 49 of 59 ETFs (83%, -3.4pp on the day) held above their 20-day moving average, yet only 22 of 58 (38%, +17.2pp) outperformed the S&P 500 SPY, leaving a +45pp gap. Leadership centered on US growth, small caps, copper miners, and Asia plus emerging markets, while low-volatility, dividend, developed ex-US, and defensive sector exposures sat on the wrong side of relative confirmation. The equity tape stayed in a concentrated participation regime.
Fixed income showed the session’s clearest breadth inflection. 11 of 17 ETFs (65%, +47.1pp on the day) held above their 20-day moving average, and 9 of 16 (56%, +18.8pp) outperformed the Aggregate Bonds AGG. Credit, short-duration corporates, mortgage-backed, EM debt, and long duration led the improvement, whereas intermediate Treasuries and inflation-linked exposures remained the weak side of the bucket. Bonds sat in a recovery regime split between stable short credit and rate-sensitive duration, not a uniform Treasury advance.
In specialty, price recovered without matching relative leadership. 11 of 15 ETFs (73%, +13.3pp on the day) held above their 20-day moving average, but only 3 of 15 (20%, -6.7pp) outperformed the S&P 500 SPY, leaving a +53pp gap as semiconductors, momentum, and clean energy led while biotech, infrastructure, covered-call income, real estate, and min-volatility lagged the benchmark despite price recoveries. Commodities printed no fresh daily crosses, though copper remained the clearest aligned strength in our broader coverage and agriculture stayed on the lagging side. Specialty stayed in a breadth-trap regime, and commodity participation stayed selective.
20-Day Tactical Breadth
Key Takeaways
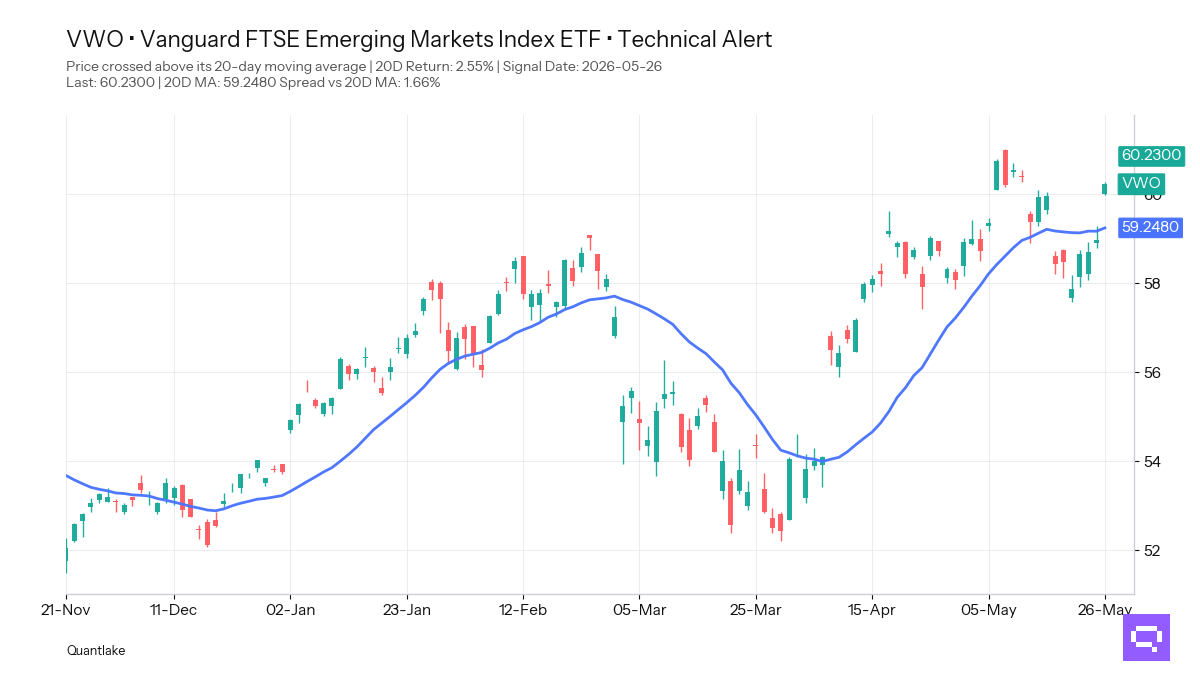
• Emerging Markets VWO with a +2.55% period return crossed above its 20-day moving average. Emg. Markets EEM also registered a relative-strength cross higher versus the S&P 500 SPY, yet emerging-market exposure still lacks full multi-horizon confirmation because VWO remains in the broader cross-timescale laggard set.
• EM Sovereign Bonds EMB and Corporate Credit VCIT crossed above both price and ratio moving averages versus the Aggregate Bonds AGG. Long Treasuries TLT did the same, but its negative 20-day return keeps that move in a rate-sensitive stabilization bucket, whereas the persistent lag in intermediate Treasury duration shows where fixed-income weakness remains concentrated.
• Biotechnology IBB and Infrastructure PAVE reclaimed their 20-day moving averages in price, yet neither theme joined the relative leaders inside specialty. Relative leadership versus the S&P 500 SPY stayed concentrated in semiconductors, clean energy, and momentum, and commodities added no fresh daily cross beyond copper holding the cleanest daily, weekly, and monthly alignment while agriculture lagged.
FEATURED ETF — Vanguard FTSE Emerging Markets VWO
Other Technical Signal Events
EQUITY
↗ Price breakouts (cross-up 20D MA)
• XLI - Industrial Select Sector · 20D perf: +1.04%
• VWO - Vanguard FTSE Emerging Markets · +2.55%
↘ Price breakdowns (cross-down 20D MA)
• XLE - Energy Select Sector · 20D perf: +1.90%
• XLP - Consumer Staples Select Sector · +1.57%
• EFAV - iShares MSCI EAFE Min Vol Factor ETF · +0.49%
• JEPI - JPMorgan Equity Premium Income ETF · -0.68%
↗ Leadership gains (cross-up 20D MA vs SPY)
• VB - Vanguard Small-Cap · 20D relative perf: -1.58%
• VGK - Vanguard FTSE Europe · -1.49%
• EWG - iShares MSCI Germany ETF · -1.03%
• MDYG - SPDR® S&P 400 Mid Cap Growth ETF · -0.51%
• VT - Vanguard Total World Stock · -0.24%
• VTI - Vanguard Total Stock Market · -0.14%
• IWM - iShares Russell 2000 ETF · -0.12%
• VEA - Vanguard FTSE Developed Markets · +0.47%
• IVLU - iShares Edge MSCI Intl Value Factor ETF · +0.86%
• EWJ - iShares MSCI Japan ETF · +0.95%
• COPX - Global X Copper Miners ETF · +2.06%
• EEM - iShares MSCI Emerging Markets ETF · +2.41%
↘ Leadership losses (cross-down 20D MA vs SPY)
• XLV - Health Care Select Sector · 20D relative perf: -1.36%
• DIA - SPDR Dow Jones Industrial Average ETF · -2.07%
FIXED INCOME
↗ Price breakouts (cross-up 20D MA)
• TLT - iShares 20+ Year Treasury Bond ETF · 20D perf: -1.00%
• MUB - iShares National Muni Bond ETF · -0.44%
• MBB - iShares MBS ETF · -0.42%
• VCIT - Vanguard Intermediate-Term Corporate Bond · -0.26%
• LQD - iShares iBoxx $ Investment Grade Corporate Bond ETF · unch.
• VCSH - Vanguard Short-Term Corporate Bond · unch.
• EMB - iShares J.P. Morgan USD Emerging Markets Bond ETF · unch.
↘ Price breakdowns (cross-down 20D MA)
None on the close
↗ Leadership gains (cross-up 20D MA vs AGG)
• TLT - iShares 20+ Year Treasury Bond ETF · 20D relative perf: -0.61%
• VCIT - Vanguard Intermediate-Term Corporate Bond · +0.14%
• EMB - iShares J.P. Morgan USD Emerging Markets Bond ETF · +0.42%
↘ Leadership losses (cross-down 20D MA vs AGG)
None on the close
SPECIALTY
↗ Price breakouts (cross-up 20D MA)
• PAVE - Global X U.S. Infrastructure Development ETF · 20D perf: unch.
• IBB - iShares Biotechnology ETF · +0.24%
↘ Price breakdowns (cross-down 20D MA)
None on the close
↗ Leadership gains (cross-up 20D MA vs SPY)
None on the close
↘ Leadership losses (cross-down 20D MA vs SPY)
• USMV - iShares MSCI USA Min Vol Factor ETF · 20D relative perf: -1.75%
COMMODITIES
No event on the close
Romain Gandon
CEO, Quantlake
Disclaimer: This article is for informational and educational purposes only and does not constitute investment advice. Past performance is not indicative of future results.