.png)

Tactical Trends: Cyclicals and Global Beta Slip Below 20D MAs
Price damage outruns SPY-relative weakness in equities
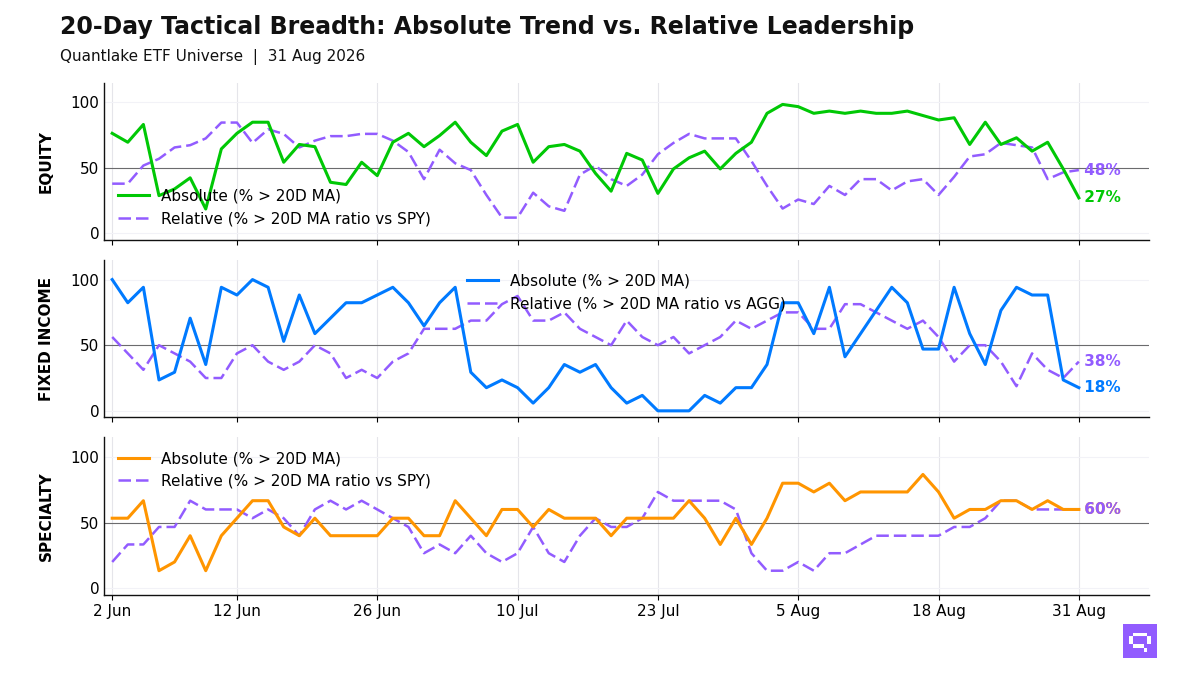
Equity breakdowns led the ETF universe on August 31, with 16 of 59 ETFs (27%, -22.0pp) above their 20-day moving average (20D MA) and 28 of 58 (48%, +1.7pp) above their 20-day ratio moving average vs the S&P 500 SPY. Low-volatility, emerging markets, and select ex-US equities hold above their 20D MA. Broad US beta, China, and dividend and value exposures crossed below. Nasdaq 100 QQQ and international dividend strength keep the price-relative gap at -21pp. The equity configuration is defensive: price damage outruns benchmark-relative damage, and leadership concentrates in low-volatility, ex-US, and selective growth.
Fixed income leadership is limited to high-yield credit and one long-duration Treasury fund, with 3 of 17 ETFs (18%, -6pp) above their 20D MA. Relative winners vs the Aggregate Bonds AGG cluster in high-yield credit, investment grade, and short duration. Treasuries and munis lag. The bond cross-section favors credit stability and lower rate sensitivity.
Specialty leadership centers on gold, bitcoin proxies, and biotech, with 9 of 15 ETFs (60%) above their 20D MA. Clean energy, real estate, and semiconductors lag the S&P 500 SPY. Commodities add an industrial-metal and energy tilt, as Copper CPER crossed above its 20-day ratio moving average vs the S&P 500 SPY and broad commodities and oil align on both price and relative measures. Hard assets, biotech, and bitcoin proxies define the specialty and commodity leaders.
20-Day Tactical Breadth
Key Takeaways
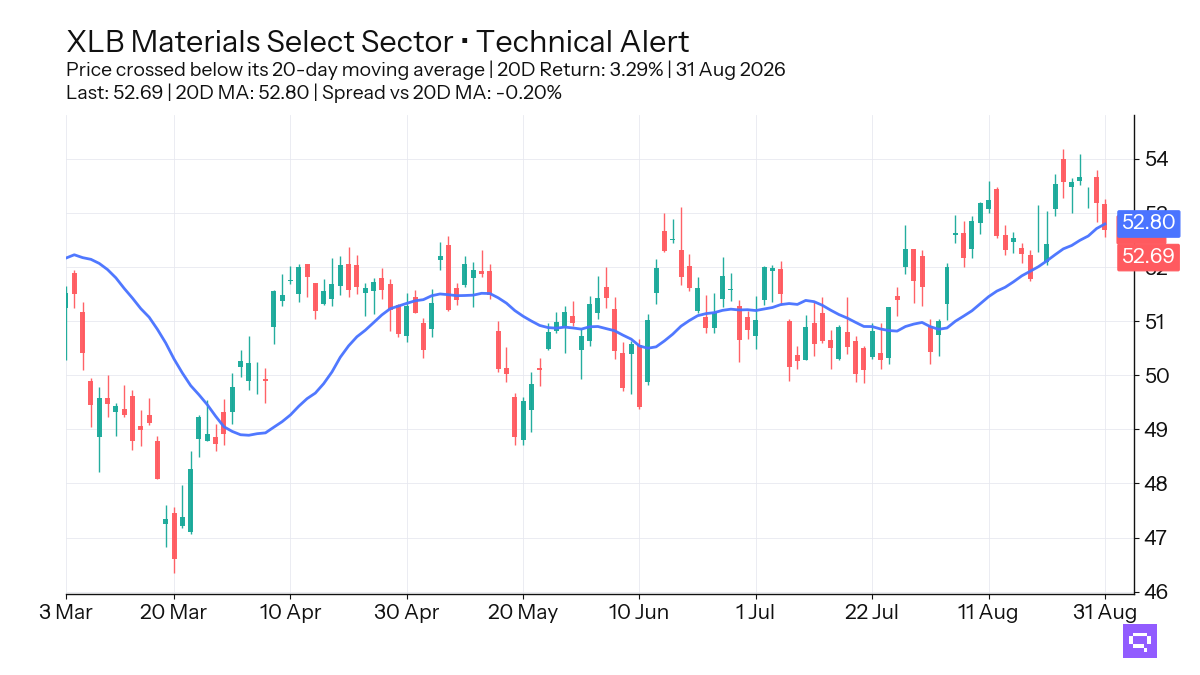
Materials XLB, up 3.29% over the trailing 20-day window, crossed below its 20-day moving average. XLB trades below its 20D MA while outperforming the S&P 500 SPY, so its price broke before its relative standing did.
Short Corporate VCSH and Short TIPS VTIP crossed above their 20-day ratio moving average versus the Aggregate Bonds AGG, while Investment Grade Credit LQD crossed below its 20D MA. The bond cross-section rewards lower rate sensitivity and selective credit.
Copper CPER crossed above its 20-day ratio moving average versus the S&P 500 SPY after a down 0.33% relative return over the trailing 20-day window, so the move fits early stabilization. Specialty leadership separates gold, bitcoin proxies, and biotech from clean energy and real estate.
FEATURED ETF: Materials Select Sector XLB
Other Technical Signal Events
Equity: Price vs 20-day MA
| Signal | Ticker | Name | 20D perf |
|---|---|---|---|
| Cross-down | XLB | Materials Select Sector | +3.29% |
| Cross-down | EWJ | iShares MSCI Japan ETF | +3.20% |
| Cross-down | VEA | Vanguard FTSE Developed Markets Index ETF | +2.65% |
| Cross-down | IQLT | iShares MSCI Intl Quality Factor ETF | +2.20% |
| Cross-down | VT | Vanguard Total World Stock Index ETF | +1.87% |
| Cross-down | SPYV | S&P 500 Value ETF | +1.49% |
| Cross-down | URTH | iShares MSCI World ETF | +1.44% |
| Cross-down | IVLU | iShares Edge MSCI Intl Value Factor ETF | +1.12% |
| Cross-down | XLF | Financial Select Sector | +0.58% |
| Cross-down | DVY | iShares Select Dividend ETF | +0.43% |
| Cross-down | EWU | iShares MSCI United Kingdom ETF | +0.29% |
| Cross-down | XLC | Communication Services Select Sector | +0.11% |
Equity vs SPY: Price Ratio vs 20-day MA
| Signal | Ticker | Name | 20D rel perf |
|---|---|---|---|
| Cross-up | INDA | iShares MSCI India ETF | -2.13% |
| Cross-up | IDV | iShares International Select Dividend ETF | -0.15% |
| Cross-up | QQQ | Invesco QQQ | +1.13% |
| Cross-down | IQLT | iShares MSCI Intl Quality Factor ETF | +0.95% |
| Cross-down | DVY | iShares Select Dividend ETF | -0.80% |
Fixed Income: Price vs 20-day MA
| Signal | Ticker | Name | 20D perf |
|---|---|---|---|
| Cross-down | LQD | iShares iBoxx $ Investment Grade Corporate Bond ETF | unch. |
Fixed Income vs AGG: Price Ratio vs 20-day MA
| Signal | Ticker | Name | 20D rel perf |
|---|---|---|---|
| Cross-up | VTIP | Vanguard Short-Term Inflation-Protected Securities Index ETF | unch. |
| Cross-up | VCSH | Vanguard Short-Term Corporate Bond Index ETF | unch. |
Commodities vs SPY: Price Ratio vs 20-day MA
| Signal | Ticker | Name | 20D rel perf |
|---|---|---|---|
| Cross-up | CPER | United States Copper LP | -0.33% |
Romain Gandon
CEO, Quantlake
Disclaimer: This article is for informational and educational purposes only and does not constitute investment advice. Past performance is not indicative of future results.