.png)
Tactical Trends: Asia and Quality Carry as Equity Leadership Narrows
Price participation faded faster than relative leadership could broaden
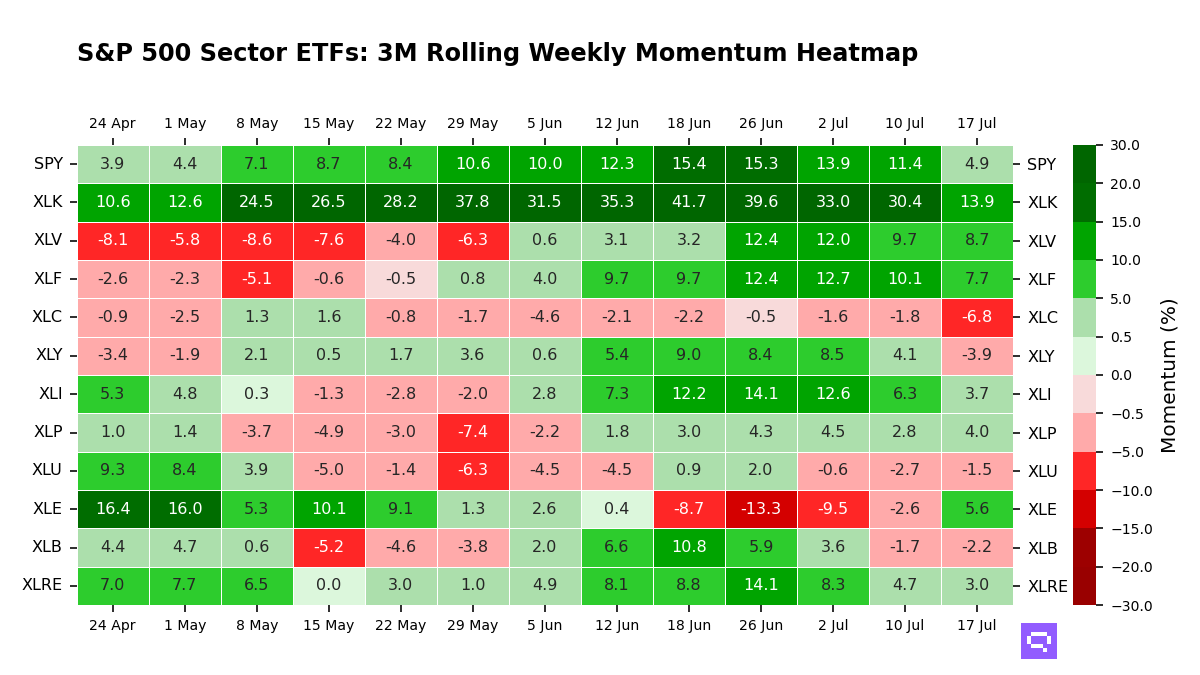
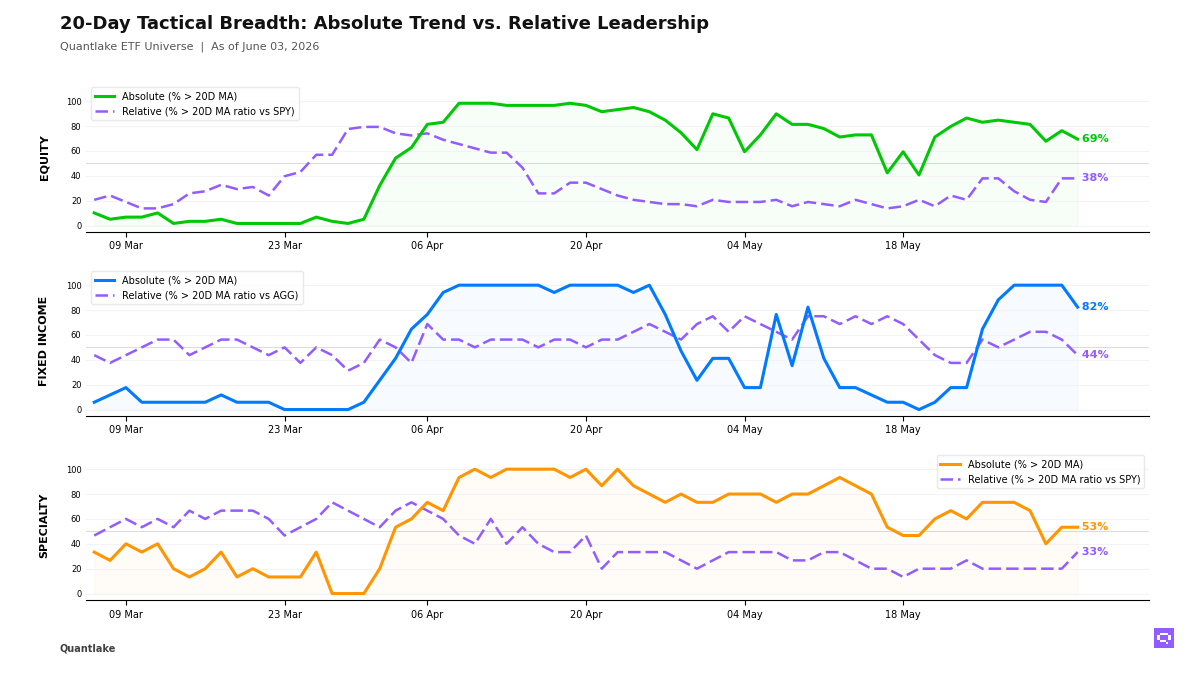
At the close, our ETF universe moved deeper into a narrow equity leadership regime. We count 41 of 59 equity ETFs (69%, -6.8pp on the day) above their 20-day moving average, yet only 22 of 58 (38%, unchanged) beat the S&P 500 SPY, leaving a +32pp gap. Leadership concentrated in Asia-Pacific equity, selective US growth, and quality, while Europe, China, low volatility, and parts of US cyclicals lost ground; that is a benchmark-led equity tape rather than a broad advance.
In fixed income, breadth deteriorated from a fully confirmed starting point, with 14 of 17 bond ETFs (82%, -17.6pp on the day) above their 20-day moving average and just 7 of 16 (44%, -12.5pp) outperforming the Aggregate Bonds AGG, leaving a +39pp gap. EM debt, credit, munis, and long duration held relative sponsorship, while intermediate Treasuries and preferreds weakened; that is selective spread and duration leadership, not a uniform bond bid.
In specialty, relative breadth improved from 20% to 33% (+13.3pp) versus the S&P 500 SPY even as price breadth held at 53%, with semiconductors, momentum, clean energy, and equity-income overlays regaining ground while crypto proxies, precious metals, and real estate stayed weak. Commodities stayed selective, with Oil USO crossing above its 20-day moving average as Copper CPER fell below its ratio moving average versus the S&P 500 SPY; that leaves hard-asset participation fragmented rather than broad.
20-Day Tactical Breadth
Key Takeaways
• Japan EWJ crossed above its 20-day ratio moving average versus the S&P 500 SPY after a 0.99% 20-day relative return. Dow Jones DIA, Russell 2000 IWM, and Emerging Markets VWO crossed below their ratio moving averages after negative 20-day relative returns. Leadership concentrated in select Asia rather than broadening across beta-sensitive equity.
• Quality Factor QUAL, Dividend Growth VIG, and S&P MidCap Value MDYV all crossed above their 20-day ratio moving averages versus the S&P 500 SPY, yet each still carried a negative 20-day relative return. The moves marked early stabilization inside quality and value rather than established leadership.
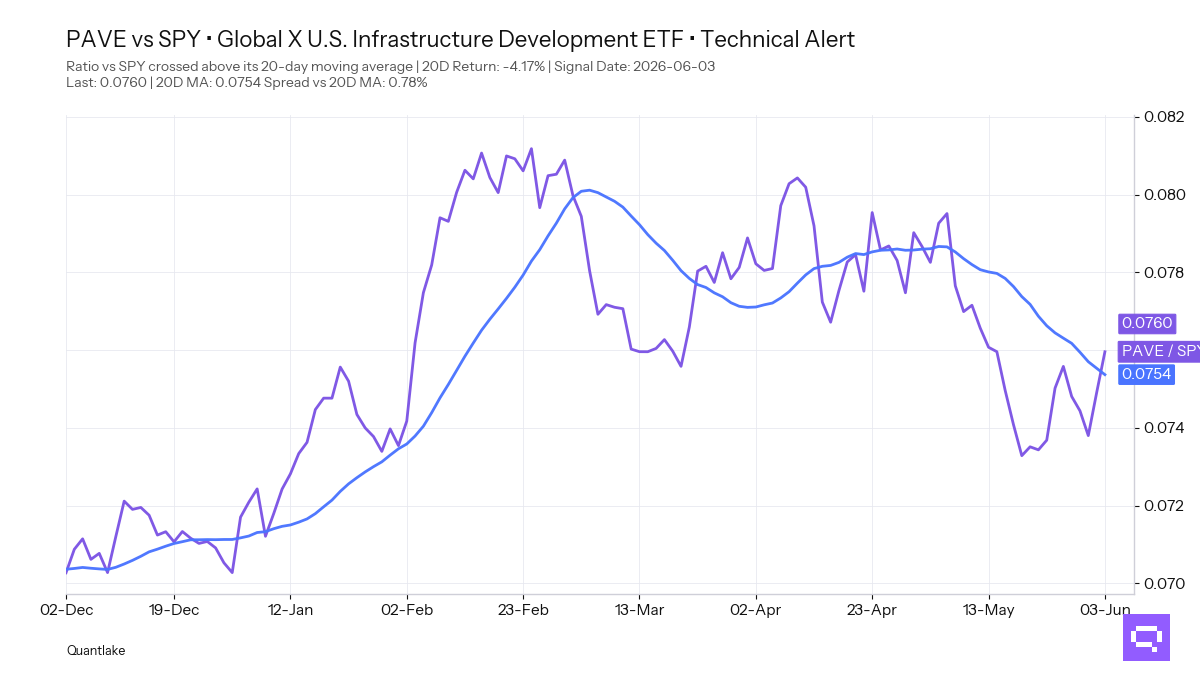
• Infrastructure PAVE, with a -4.17% period relative return versus S&P 500 SPY, crossed above its 20-day ratio moving average. 3-7yr Treasuries IEI and Int. Treasuries VGIT both crossed below their 20-day moving averages, and High Yield HYG slipped below its ratio moving average versus the Aggregate Bonds AGG. That combination kept specialty improving at the margin while the bond rotation stayed selective.
FEATURED ETF — Global X U.S. Infrastructure Development ETF PAVE vs SPY
Other Technical Signal Events
EQUITY
↗ Price breakouts (cross-up 20D MA)
• XLE - Energy Select Sector · 20D perf: -1.24%
• XLV - Health Care Select Sector · +1.55%
↘ Price breakdowns (cross-down 20D MA)
• VGK - Vanguard FTSE Europe · 20D perf: +1.19%
• EWG - iShares MSCI Germany ETF · +0.90%
• ACWV - iShares MSCI Global Min Vol Factor ETF · +0.64%
• IQLT - iShares MSCI Intl Quality Factor ETF · +0.31%
• EWU - iShares MSCI United Kingdom ETF · unch.
• MCHI - iShares MSCI China ETF · -2.17%
↗ Leadership gains (cross-up 20D MA vs SPY)
• MDYV - SPDR® S&P 400 Mid Cap Value ETF · 20D relative perf: -3.32%
• VIG - Vanguard Dividend Appreciation · -1.26%
• QUAL - iShares MSCI USA Quality Factor ETF · -0.28%
• EWJ - iShares MSCI Japan ETF · +0.99%
↘ Leadership losses (cross-down 20D MA vs SPY)
• IWF - iShares Russell 1000 Growth ETF · 20D relative perf: +0.92%
• DIA - SPDR Dow Jones Industrial Average ETF · -1.01%
• IWM - iShares Russell 2000 ETF · -2.30%
• VWO - Vanguard FTSE Emerging Markets · -2.47%
FIXED INCOME
↗ Price breakouts (cross-up 20D MA)
None on the close
↘ Price breakdowns (cross-down 20D MA)
• VGIT - Vanguard Intermediate-Term Treasury · 20D perf: -0.22%
• IEI - iShares 3-7 Year Treasury Bond ETF · -0.22%
• PFF - iShares Preferred and Income Securities ETF · -0.26%
↗ Leadership gains (cross-up 20D MA vs AGG)
None on the close
↘ Leadership losses (cross-down 20D MA vs AGG)
• HYG - iShares iBoxx $ High Yield Corporate Bond ETF · 20D relative perf: +0.15%
• PFF - iShares Preferred and Income Securities ETF · -0.32%
SPECIALTY
↗ Price breakouts (cross-up 20D MA)
None on the close
↘ Price breakdowns (cross-down 20D MA)
None on the close
↗ Leadership gains (cross-up 20D MA vs SPY)
• PAVE - Global X U.S. Infrastructure Development ETF · 20D relative perf: -4.17%
• JEPQ - JPMorgan Nasdaq Equity Premium Income ETF · -0.29%
↘ Leadership losses (cross-down 20D MA vs SPY)
None on the close
COMMODITIES
↗ Price breakouts (cross-up 20D MA)
• USO - United States Oil Fund LP · 20D perf: -2.30%
↘ Price breakdowns (cross-down 20D MA)
None on the close
↗ Leadership gains (cross-up 20D MA vs SPY)
None on the close
↘ Leadership losses (cross-down 20D MA vs SPY)
• CPER - United States Copper LP · 20D relative perf: +4.12%
Romain Gandon
CEO, Quantlake
Disclaimer: This article is for informational and educational purposes only and does not constitute investment advice. Past performance is not indicative of future results.