Tactical Market Trends: Low Volatility and Value Lead Equities
Bond leadership concentrates in EM debt and long duration
Value, low volatility, and developed ex-US define the equity leader cluster at the close on October 29. Across our ETF universe, 40 of 59 equity ETFs (68%, +3.4pp) hold above their 20-day moving average (20D MA), and 42 of 58 (72%, +8.6pp) hold above their ratio MA vs the S&P 500 SPY. China, EM Asia, and US growth define the laggard cluster. Daily, weekly, and monthly equity alignment is 49%.
Fixed income leadership vs the Aggregate Bonds AGG is limited to EM debt, long duration, inflation-linked, and select investment-grade exposure, with 7 of 16 above their ratio MA. U.S. core aggregate, high yield, and short duration hold above their price MAs and below their ratio MAs vs the benchmark.
Specialty leadership vs the S&P 500 SPY is limited to biotech, infrastructure, real estate, and minimum volatility, with 5 of 15 above both their price MA and ratio MA. Managed futures, precious metals, and crypto define the laggard cluster. Broad commodities and oil lead commodities. Agriculture and silver lag.

Key Takeaways
India INDA rose 2.26% over the trailing 20-day window and crossed above its 20D MA. Its ratio vs the S&P 500 SPY also crossed above its 20-day ratio MA after a 1.55% relative gain over the trailing 20-day window.
Intl Momentum IMTM and S&P MidCap Growth MDYG crossed above both their price MA and their ratio MA vs the S&P 500 SPY. Their trailing 20-day relative returns are down 1.25% and down 1.51%.
EM Sovereign Bonds EMB crossed above its ratio MA vs the Aggregate Bonds AGG after a 0.37% 20-day relative gain. In duration, 1 of 2 short-duration ETFs and 1 of 1 long-duration ETFs hold above their price MA, and only the long-duration category clears its ratio MA.
Featured ETF: iShares MSCI India ETF INDA

Technical Signals
Equity: Price vs 20-day MA
| Signal | Ticker | Name | 20D perf |
|---|---|---|---|
| Cross-up | MDYG | SPDR S&P 400 Mid Cap Growth ETF | -0.81% |
| Cross-up | IMTM | iShares MSCI Intl Momentum Factor ETF | -0.55% |
| Cross-up | IVLU | iShares Edge MSCI Intl Value Factor ETF | +0.83% |
| Cross-up | INDA | iShares MSCI India ETF | +2.26% |
| Cross-down | VTI | Vanguard Total Stock Market Index ETF | +0.82% |
Equity vs SPY: Price Ratio vs 20-day MA
| Signal | Ticker | Name | 20D rel perf |
|---|---|---|---|
| Cross-up | MDYG | SPDR S&P 400 Mid Cap Growth ETF | -1.51% |
| Cross-up | IMTM | iShares MSCI Intl Momentum Factor ETF | -1.25% |
| Cross-up | VT | Vanguard Total World Stock Index ETF | -0.59% |
| Cross-up | IVLU | iShares Edge MSCI Intl Value Factor ETF | +0.12% |
| Cross-up | INDA | iShares MSCI India ETF | +1.55% |
Fixed Income vs AGG: Price Ratio vs 20-day MA
| Signal | Ticker | Name | 20D rel perf |
|---|---|---|---|
| Cross-up | EMB | iShares J.P. Morgan USD Emerging Markets Bond ETF | +0.37% |
Specialty: Price vs 20-day MA
| Signal | Ticker | Name | 20D perf |
|---|---|---|---|
| Cross-down | DBMF | iMGP DBi Managed Futures Strategy ETF | -0.46% |
Related
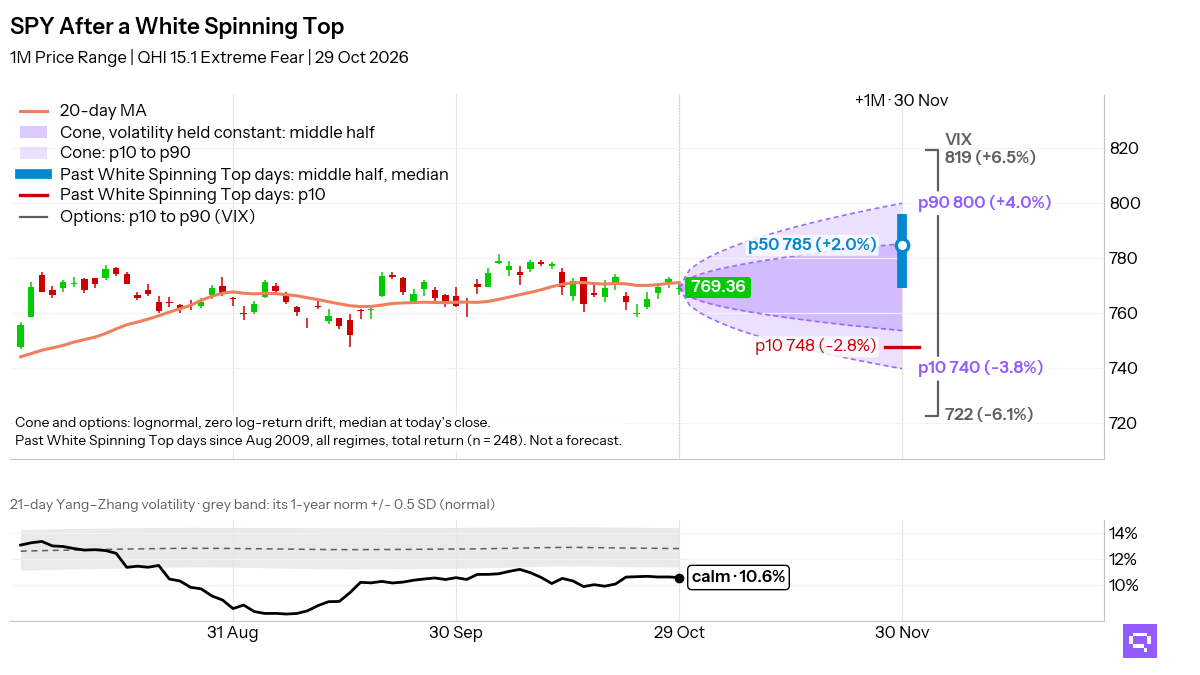
- SPY candlestick signals: forward returns by pattern and sentiment
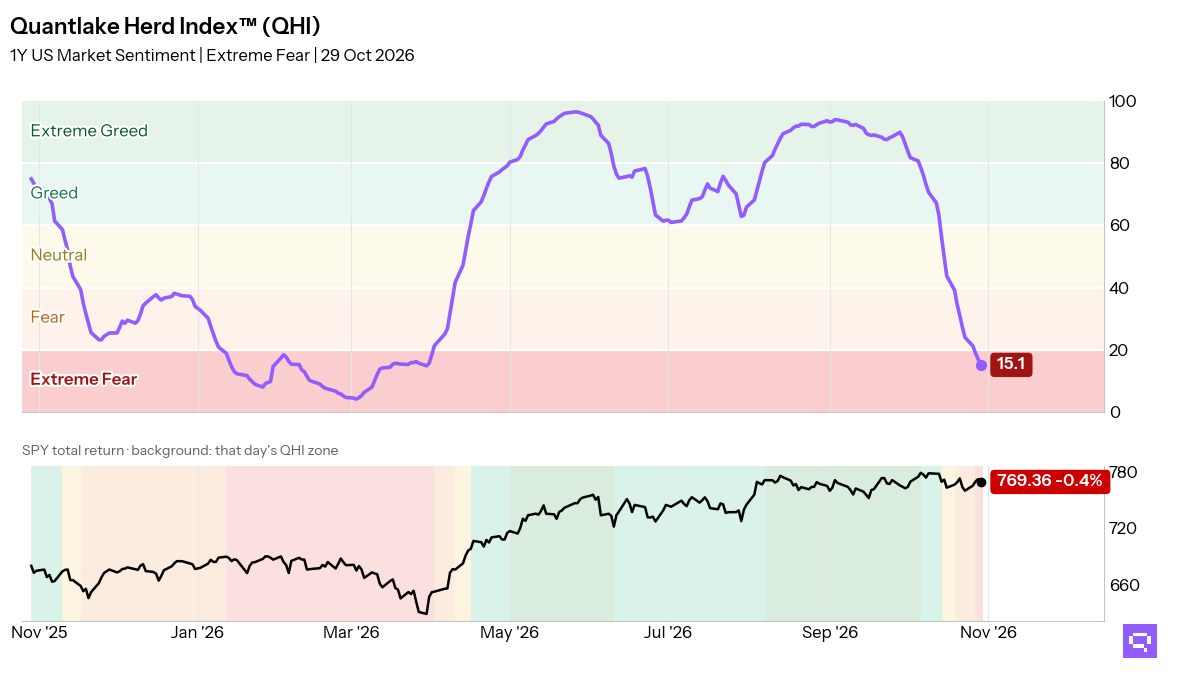
- Fear and greed: today's market sentiment reading
- ETF trend metrics explained
Romain Gandon
CEO, Quantlake
Disclaimer: This article is for informational and educational purposes only and does not constitute investment advice. Past performance is not indicative of future results.