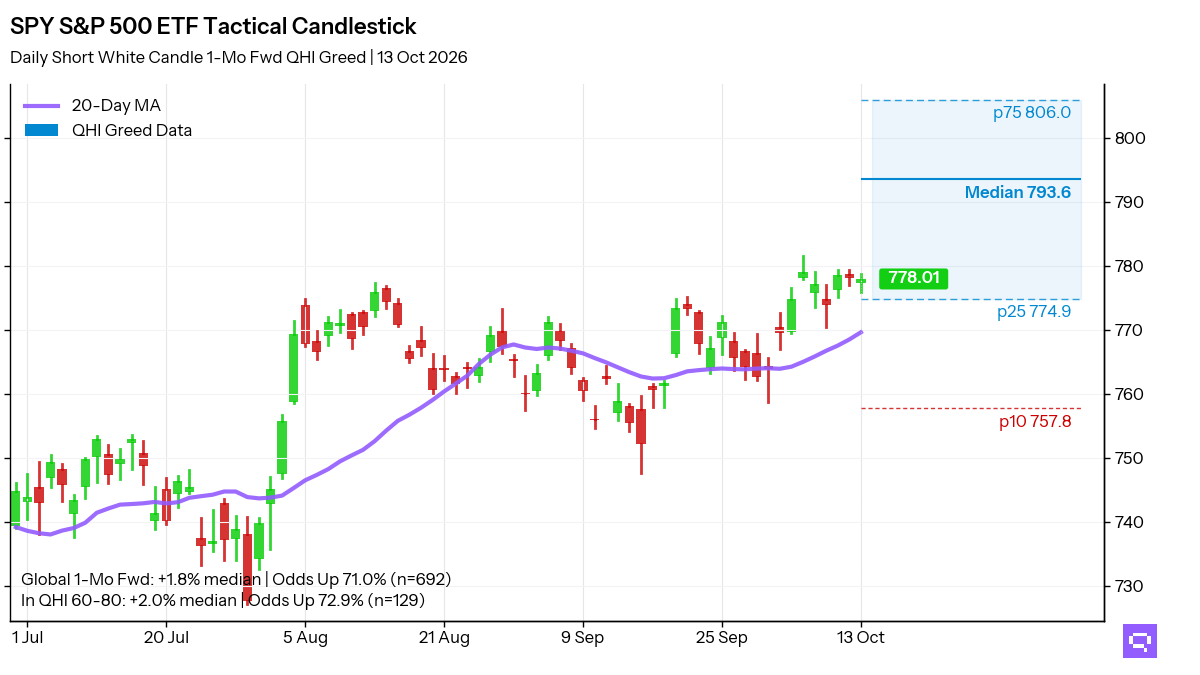
.png)

Tactical Market Trends: Equity Recovery Widens the Price-Relative Gap
Equity alignment is 41%; Brazil and energy lead across timeframes.
Equity price participation at the close on October 13 is well ahead of relative leadership. Thirty-seven of 59 ETFs (63%, +8.5pp on the day) closed above their 20-day moving averages (20D MA), and 10 of 58 (17%, -1.7pp) closed above their ratio MAs vs S&P 500 SPY. The price-relative gap is 45pp. Price leaders include 2 low-volatility funds, 2 quality funds, and 5 US equity funds. Relative laggards vs SPY include 10 international and global equity funds and 3 US equity funds. Two low-volatility funds are above their price averages and below their ratio MAs.
Fixed income leadership favors intermediate Treasuries, mortgages, munis, and short duration. Seven of 17 ETFs closed above their 20-day averages. Relative winners vs Aggregate Bonds AGG cluster in short and intermediate duration. Short duration contributes 2 price leaders. Long duration contributes none.
Specialty leadership is limited to managed futures, flexible equity, and low volatility. Only 3 names closed above their ratio MAs vs S&P 500 SPY. Commodities split between Agriculture Basket DBA above its 20-day average and Oil USO above its ratio MA vs S&P 500 SPY.
20-Day Tactical Breadth

Key Takeaways
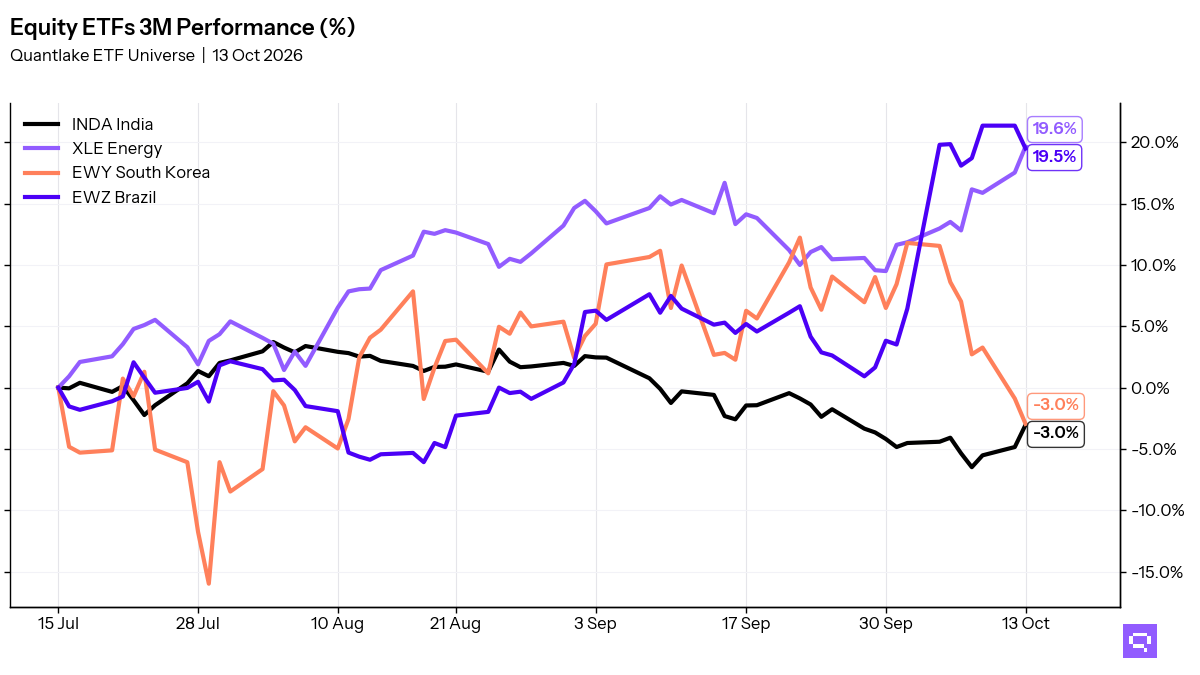
Dividend Aristocrats SDY crossed above its ratio MA vs S&P 500 SPY. S&P Growth SPYG and Healthcare XLV crossed below their ratio MAs. Brazil equity and Energy rank as the two relative leaders across the daily, weekly, and monthly views. Total equity alignment is 41%.
3-7yr Treasuries IEI and Muni Bonds MUB crossed above their 20-day averages at the close. MUB also crossed above its ratio MA vs Aggregate Bonds AGG. Corporate Credit VCIT crossed below its ratio MA vs its benchmark.
Bitcoin IBIT, up 9.32% over the trailing 20-day window, crossed above its 20-day MA. Copper CPER, up 1.58% over the trailing 20-day window, crossed below its ratio MA vs S&P 500 SPY. Agriculture Basket DBA, down 1.56% over the trailing 20-day window, crossed above its 20-day MA.
Featured ETF: iShares Bitcoin IBIT

Technical Signals
Equity: Price vs 20-day MA
| Signal | Ticker | Name | 20D perf |
|---|---|---|---|
| Cross-up | EFAV | iShares MSCI EAFE Min Vol Factor ETF | -1.71% |
| Cross-up | MDYV | SPDR S&P 400 Mid Cap Value ETF | -1.55% |
| Cross-up | XLB | Materials Select Sector | -1.54% |
| Cross-up | XLC | Communication Services Select Sector | -1.21% |
| Cross-up | INDA | iShares MSCI India ETF | -0.74% |
| Cross-up | IQLT | iShares MSCI Intl Quality Factor ETF | -0.38% |
| Cross-down | EWT | iShares MSCI Taiwan ETF | +6.37% |
Equity vs SPY: Price Ratio vs 20-day MA
| Signal | Ticker | Name | 20D rel perf |
|---|---|---|---|
| Cross-up | SDY | SPDR S&P Dividend ETF | -3.85% |
| Cross-down | SPYG | S&P 500 Growth ETF | +2.13% |
| Cross-down | XLV | Health Care Select Sector | -1.36% |
Fixed Income: Price vs 20-day MA
| Signal | Ticker | Name | 20D perf |
|---|---|---|---|
| Cross-up | MBB | iShares MBS ETF | -0.99% |
| Cross-up | MUB | iShares National Muni Bond ETF | -0.80% |
| Cross-up | VGIT | Vanguard Intermediate-Term Treasury Index ETF | -0.54% |
| Cross-up | IEI | iShares 3-7 Year Treasury Bond ETF | -0.38% |
Fixed Income vs AGG: Price Ratio vs 20-day MA
| Signal | Ticker | Name | 20D rel perf |
|---|---|---|---|
| Cross-up | MUB | iShares National Muni Bond ETF | unch. |
| Cross-down | VCIT | Vanguard Intermediate-Term Corporate Bond Index ETF | unch. |
Specialty: Price vs 20-day MA
| Signal | Ticker | Name | 20D perf |
|---|---|---|---|
| Cross-up | IBIT | iShares Bitcoin | +9.32% |
Commodities: Price vs 20-day MA
| Signal | Ticker | Name | 20D perf |
|---|---|---|---|
| Cross-up | DBA | Invesco DB Agriculture | -1.56% |
Commodities vs SPY: Price Ratio vs 20-day MA
| Signal | Ticker | Name | 20D rel perf |
|---|---|---|---|
| Cross-up | USO | United States Oil Fund LP | -8.15% |
| Cross-down | CPER | United States Copper LP | +1.58% |
Related
- SPY candlestick signals: forward returns by pattern and sentiment
- Fear and greed: today's market sentiment reading
- ETF trend metrics explained
Romain Gandon
CEO, Quantlake
Disclaimer: This article is for informational and educational purposes only and does not constitute investment advice. Past performance is not indicative of future results.