Tactical Market Trends: Dow and Developed Markets Reclaim 20-Day Lines
42 of 59 equity ETFs hold above their 20-day MA, up 17.0pp
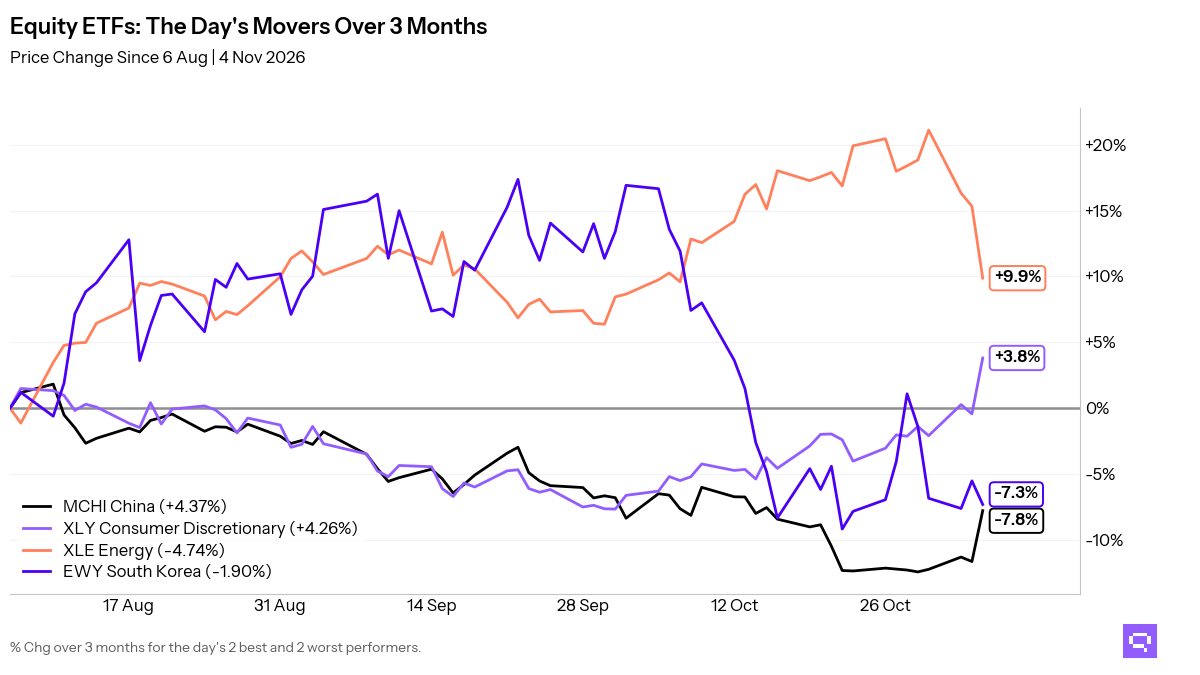
Broad equity participation dominates the November 4 close. Dow Jones DIA and developed-market exposures led the day’s confirmed price and relative cross-ups, and China MCHI joined that group. Across our ETF universe, 42 of 59 equity ETFs (71%, +17.0pp on the day) hold above their 20-day moving average (20D MA), and 42 of 58 (72%, -1.7pp) outperform the S&P 500 SPY on a 20-day ratio basis. The price-relative gap is -1pp. Lagging clusters are US growth, momentum, and emerging markets.
Fixed income price participation is complete, with 17 of 17 ETFs above their 20-day averages. Relative leadership vs Aggregate Bonds AGG is concentrated in EM debt, investment-grade credit, and long duration. Mortgages and munis also rank in the winner cluster. Short duration has 2 of 2 above their price averages and 0 of 2 above their ratio MAs. Long duration has 1 of 1 on both measures.
Specialty leadership is selective, with 8 of 15 above their 20-day averages. Gold Miners GDX and real estate-linked names lead that group. Lagging clusters are semiconductors, managed futures, and momentum. Commodity signals softened through Oil USO, which crossed below its ratio MA vs the S&P 500 SPY. Silver and broad commodity exposure also fill the cross-timescale laggard group.

Key Takeaways
Ethereum ETHA fell 5.78% over the trailing 20-day window and crossed above its 20D MA. Its ratio vs the S&P 500 SPY also crossed above its 20-day ratio MA.
Equity cross-timescale alignment is 66%. Low-volatility, dividend-oriented US equity, and quality and equal-weight factors define the aligned relative winners. Emerging markets, Asia, and US growth define the aligned laggards.
Fixed-income cross-timescale alignment is 18%. Mortgage-backed securities and munis define the aligned relative winners. Intermediate Treasuries, preferreds, and TIPS define the aligned laggards.
Featured ETF: iShares Ethereum Trust ETF ETHA

Technical Signals
Equity: Price vs 20-day MA
| Signal | Ticker | Name | 20D perf |
|---|---|---|---|
| Cross-up | VT | Vanguard Total World Stock Index ETF | -1.15% |
| Cross-up | VTI | Vanguard Total Stock Market Index ETF | -1.08% |
| Cross-up | URTH | iShares MSCI World ETF | -0.38% |
| Cross-up | MCHI | iShares MSCI China ETF | -0.15% |
| Cross-up | QUAL | iShares MSCI USA Quality Factor ETF | +0.50% |
| Cross-up | VEA | Vanguard FTSE Developed Markets Index ETF | +0.80% |
| Cross-up | IVLU | iShares Edge MSCI Intl Value Factor ETF | +2.43% |
| Cross-up | EFA | iShares MSCI EAFE ETF | +2.54% |
| Cross-up | FXI | iShares China Large-Cap ETF | +3.50% |
| Cross-up | DIA | SPDR Dow Jones Industrial Average ETF | +4.35% |
Equity vs SPY: Price Ratio vs 20-day MA
| Signal | Ticker | Name | 20D rel perf |
|---|---|---|---|
| Cross-up | MCHI | iShares MSCI China ETF | +1.20% |
| Cross-down | XLE | State Street Energy Select Sector SPDR ETF | +1.61% |
| Cross-down | VLUE | iShares MSCI USA Value Factor ETF | -2.71% |
Fixed Income: Price vs 20-day MA
| Signal | Ticker | Name | 20D perf |
|---|---|---|---|
| Cross-up | PFF | iShares Preferred and Income Securities ETF | -1.60% |
Fixed Income vs AGG: Price Ratio vs 20-day MA
| Signal | Ticker | Name | 20D rel perf |
|---|---|---|---|
| Cross-up | VCIT | Vanguard Intermediate-Term Corporate Bond Index ETF | -0.29% |
| Cross-up | EMB | iShares J.P. Morgan USD Emerging Markets Bond ETF | -0.28% |
| Cross-up | LQD | iShares iBoxx $ Investment Grade Corporate Bond ETF | +0.18% |
| Cross-down | VGIT | Vanguard Intermediate-Term Treasury Index ETF | -0.41% |
Specialty: Price vs 20-day MA
| Signal | Ticker | Name | 20D perf |
|---|---|---|---|
| Cross-up | ETHA | iShares Ethereum Trust ETF | -5.78% |
| Cross-up | ICLN | iShares Global Clean Energy ETF | -4.10% |
| Cross-up | GDX | VanEck Gold Miners ETF | -1.02% |
Specialty vs SPY: Price Ratio vs 20-day MA
| Signal | Ticker | Name | 20D rel perf |
|---|---|---|---|
| Cross-up | ETHA | iShares Ethereum Trust ETF | -4.50% |
| Cross-up | GDX | VanEck Gold Miners ETF | +0.33% |
| Cross-down | FTLS | First Trust Long/Short Equity ETF | -0.62% |
| Cross-down | DBMF | iMGP DBi Managed Futures Strategy ETF | -3.48% |
Commodities vs SPY: Price Ratio vs 20-day MA
| Signal | Ticker | Name | 20D rel perf |
|---|---|---|---|
| Cross-down | USO | United States Oil Fund LP | +2.41% |
Related
- SPY candlestick signals: forward returns by pattern and sentiment
- Fear and greed: today's market sentiment reading
- ETF trend metrics explained
Romain Gandon
CEO, Quantlake
Disclaimer: This article is for informational and educational purposes only and does not constitute investment advice. Past performance is not indicative of future results.