Tactical Market Trends: Defensive Equity Leadership Shifts Overseas
Low-volatility and international names account for 6 leaders
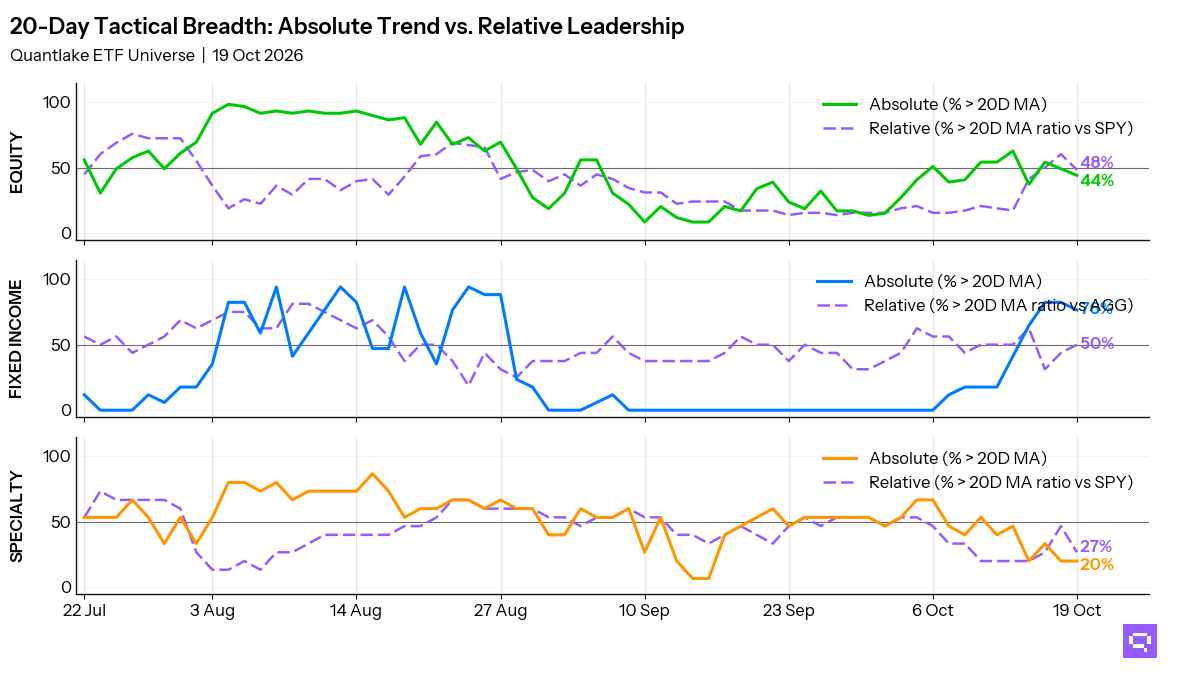
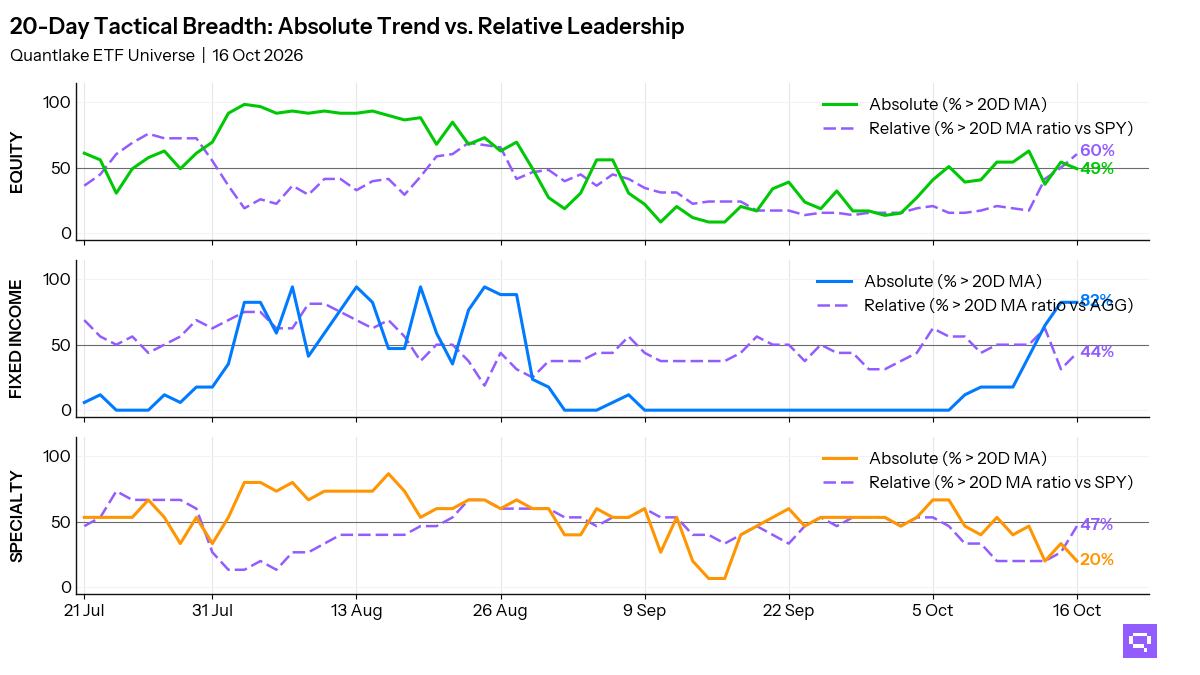
At the October 16 close, low-volatility and international equity leadership stands out. Equity price participation shows 29 of 59 ETFs (49%, -5.1pp on the day) above their 20-day moving averages (20D MA), and 35 of 58 (60%, +10.3pp) outperform the S&P 500 SPY on a ratio basis. Low-volatility, developed ex-US, and European equity themes account for 6 of those 35 relative leaders. US growth and Asia-Pacific equities account for 8 of the 23 relative laggards. Relative leadership exceeds price participation by 11pp.
Fixed income price participation is broad, with 14 of 17 above their 20-day MAs. Leadership vs Aggregate Bonds AGG is concentrated in Treasuries, TIPS, mortgages, munis, and one investment-grade fund. Short duration has 2 names above their MAs. Long duration has 1.
Specialty leadership is narrow, with 3 of 15 above their price MAs. Managed futures and gold form the main divergence vs the S&P 500 SPY, with price below the 20-day MA and ratio above the ratio MA. Agriculture, oil, and broad commodities lead the commodity names on a relative basis vs the S&P 500 SPY. Silver fills the laggard cluster.
20-Day Tactical Breadth
Key Takeaways
Intl High Dividend IDV, down 2.47% over the trailing 20-day window, crossed above its 20D MA. IDV also crossed above its 20-day ratio MA vs S&P 500 SPY.
TIPS TIP and Int. Treasuries VGIT crossed above their 20-day ratio MAs vs Aggregate Bonds AGG. Fixed-income cross-timescale alignment is 24%. The relative leader set is confined to inflation-linked and Treasury duration.
Managed Futures DBMF, up 1.94% over the trailing 20-day window, crossed below its 20D MA. Gold GLD and Agriculture Basket DBA crossed above their 20-day ratio MAs vs S&P 500 SPY.
Featured ETF: iShares International Select Dividend ETF IDV

Technical Signals
Equity: Price vs 20-day MA
| Signal | Ticker | Name | 20D perf |
|---|---|---|---|
| Cross-up | IDV | iShares International Select Dividend ETF | -2.47% |
| Cross-down | XLC | Communication Services Select Sector | -0.11% |
| Cross-down | URTH | iShares MSCI World ETF | -0.21% |
| Cross-down | FXI | iShares China Large-Cap ETF | -1.40% |
Equity vs SPY: Price Ratio vs 20-day MA
| Signal | Ticker | Name | 20D rel perf |
|---|---|---|---|
| Cross-up | IVLU | iShares Edge MSCI Intl Value Factor ETF | -2.92% |
| Cross-up | IDV | iShares International Select Dividend ETF | -2.67% |
| Cross-up | SLYV | SPDR S&P 600 Small Cap Value ETF | -2.05% |
| Cross-up | EWG | iShares MSCI Germany ETF | -1.58% |
| Cross-up | EFA | iShares MSCI EAFE ETF | -1.55% |
| Cross-up | XLI | Industrial Select Sector | -1.11% |
| Cross-up | URTH | iShares MSCI World ETF | -0.41% |
| Cross-down | XLC | Communication Services Select Sector | -0.32% |
Fixed Income vs AGG: Price Ratio vs 20-day MA
| Signal | Ticker | Name | 20D rel perf |
|---|---|---|---|
| Cross-up | VGIT | Vanguard Intermediate-Term Treasury Index ETF | +0.50% |
| Cross-up | TIP | iShares TIPS Bond ETF | +0.51% |
Specialty: Price vs 20-day MA
| Signal | Ticker | Name | 20D perf |
|---|---|---|---|
| Cross-down | DBMF | iMGP DBi Managed Futures Strategy ETF | +1.94% |
| Cross-down | IBB | iShares Biotechnology ETF | -1.26% |
Specialty vs SPY: Price Ratio vs 20-day MA
| Signal | Ticker | Name | 20D rel perf |
|---|---|---|---|
| Cross-up | GLD | SPDR Gold | -4.97% |
| Cross-up | REET | iShares Global REIT ETF | -1.50% |
| Cross-up | PAVE | Global X U.S. Infrastructure Development ETF | -0.54% |
| Cross-up | FTLS | First Trust Long/Short Equity ETF | +0.31% |
| Cross-down | IBB | iShares Biotechnology ETF | -1.46% |
Commodities vs SPY: Price Ratio vs 20-day MA
| Signal | Ticker | Name | 20D rel perf |
|---|---|---|---|
| Cross-up | DBA | Invesco DB Agriculture | unch. |
Related
- SPY candlestick signals: forward returns by pattern and sentiment
- Fear and greed: today's market sentiment reading
- ETF trend metrics explained
Romain Gandon
CEO, Quantlake
Disclaimer: This article is for informational and educational purposes only and does not constitute investment advice. Past performance is not indicative of future results.