.png)
Sector Rotation: Staples Lead as Dispersion Turns Low
Dispersion transitional-low; Technology XLK rolls over from the leading quadrant; Consumer Staples XLP rebounds higher from lagging.
US equity sector dispersion sits in a transitional-low regime, with correlation pressure rising and the payoff to sector selection narrowing. The cross-sectional standard deviation of returns across the eleven S&P 500 sector ETFs sits at a -1.16 z-score against its GARCH-normalized mean. Dispersion velocity at -4.86, the 5-session change, showed the spread narrowed sharply over the past five sessions, leaving a more compressed cross-section. Sector positions below are relative-strength z-scores against the equal-weighted basket, where +1 marks one standard deviation of outperformance.
Consumer Staples XLP led the cross-section this week at +0.28 on the 5-day horizon. XLP posted 20-day relative strength at -0.03 and 13-week at -0.05 from the Lagging quadrant. Its tail ran up and right over the week, tactical velocity at +0.05 and structural at +0.03. Velocity here is the 5-session change in its relative-strength line, tactical on the 20-day and structural on the 13-week. Real Estate XLRE holds the structural lead from the Leading quadrant, positive on both horizons, with 20-day at +0.10 and 13-week at +0.03. Its current-week reading sits at -0.02. The baton sits with rebounds this week. The structural anchor sits with XLRE.
Technology XLK drove the rotation, with the steepest tail on the board at tactical velocity -0.15 and structural -0.02. XLK ranked fourth on the week at +0.09, shifted -1 versus its 20-day rank, and rolled over inside Leading. Energy XLE matched that pattern lower in the field, with tactical velocity -0.13 and structural -0.06. XLE ranked tenth at -0.20 and shifted -3. Against that fade, Financial XLF, XLRE, and Materials XLB swept up, with four of eleven sectors posting positive current-week readings. The cross-section favored rebounds and emerging leadership over entrenched separation.
XLK’s rollover and XLP’s rebound leave the tape rotating away from the prior anchor. The read confirms if XLF and XLRE carry their positive two-horizon structure forward. The setup breaks if the rebound cohort loses its 20-day footing.
Sector Rotation Map
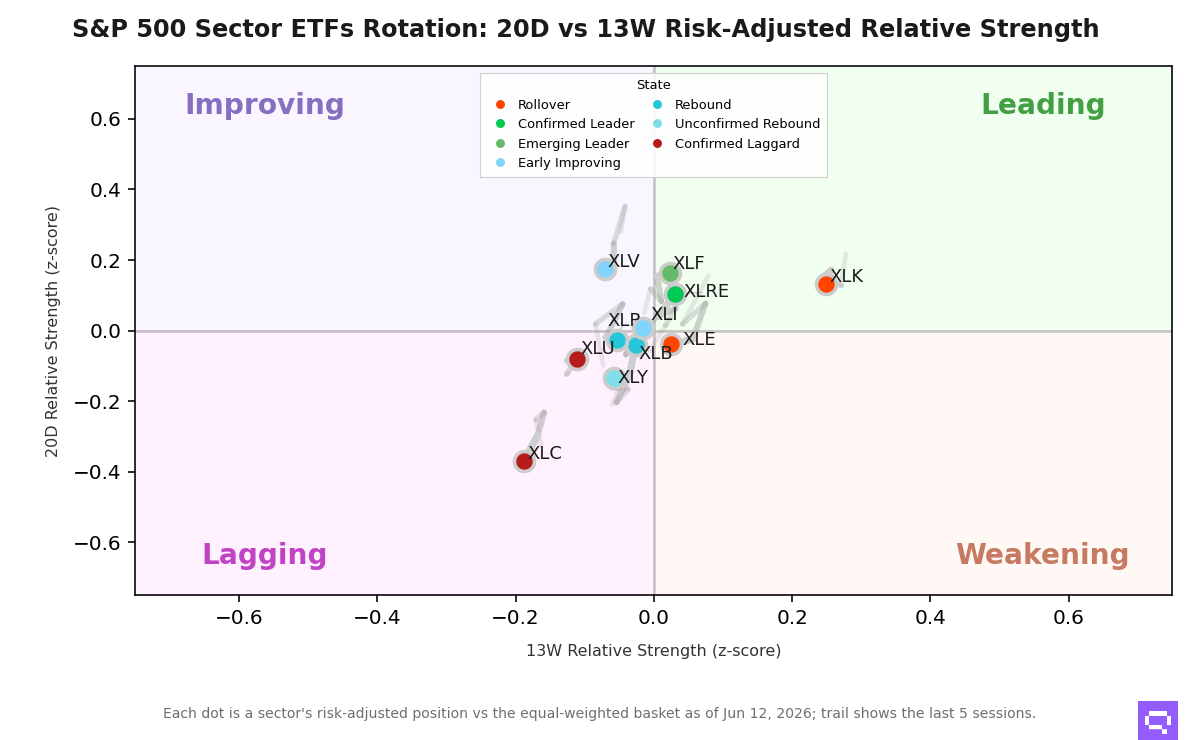
Alpha Z: risk-adjusted relative strength vs the equal-weighted S&P 500 sector basket (Z-score). Velocity: rate of change in short-term relative strength (1D vs 5D Z-score delta — tactical momentum). Structural velocity: smoothed 5D vs 20D momentum delta, reflecting regime-level directional shifts.
Structural Leaders
• Financial — emerging_leader | Rank #3 (5D) | 5D Alpha Z: +0.11 | Velocity: +0.14
• Real Estate — confirmed_leader | Rank #6 (5D) | 5D Alpha Z: -0.02 | Velocity: +0.10
Rotation Warnings
• Technology — rollover | Rank shift (5D vs 20D): -1 | Velocity: -0.15
• Energy — rollover | Rank shift (5D vs 20D): -3 | Velocity: -0.13
Recovering Sectors
• Consumer Staples — rebound | 5D Alpha Z: +0.28 | Velocity: +0.05
• Materials — rebound | 5D Alpha Z: +0.18 | Velocity: +0.06
• Consumer Discretionary — unconfirmed_rebound | 5D Alpha Z: +0.01 | Velocity: +0.10
• Industrial — early_improving | 5D Alpha Z: -0.05 | Velocity: +0.01
• Health Care — early_improving | 5D Alpha Z: -0.16 | Velocity: -0.05
Romain Gandon
CEO, Quantlake
Disclaimer: This article is for informational and educational purposes only and does not constitute investment advice. Past performance is not indicative of future results.