.png)
Intermediate Trends: Small Caps and EM Lift a Benchmark-Led Equity Tape
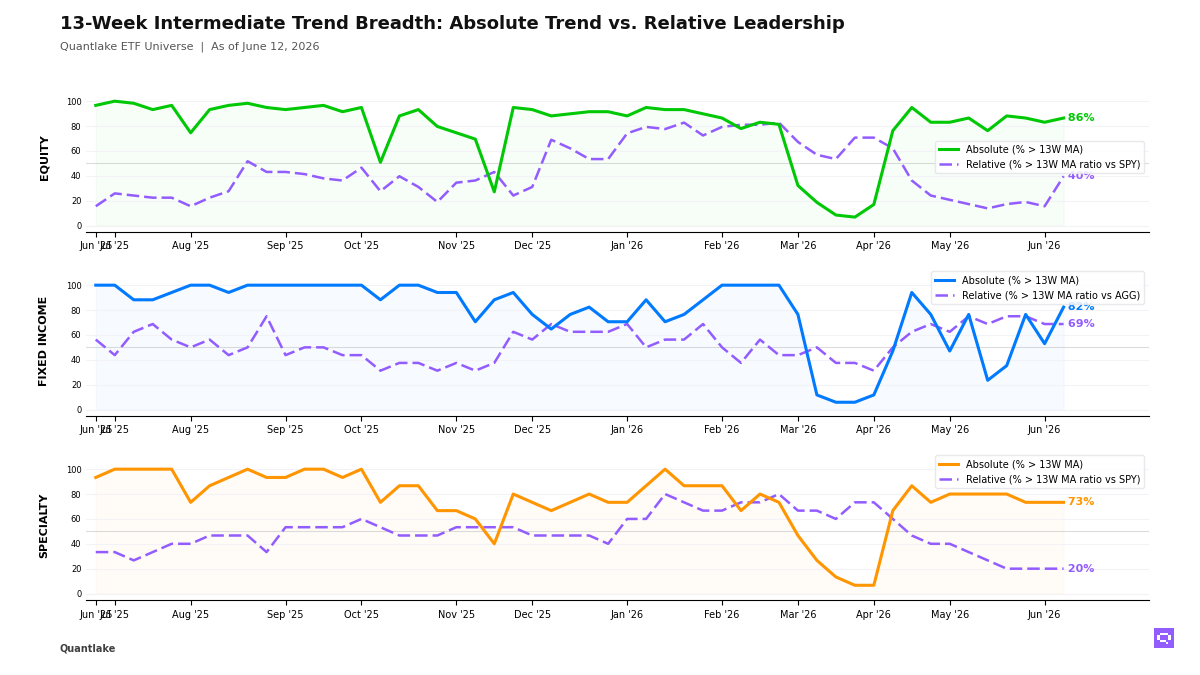
Price breadth improved faster than SPY-relative leadership
Over the week, equity leadership rotated toward smaller-cap, cyclical, and emerging-market exposures. As of June 12, 51 of 59 ETFs (86%, +3.4pp) sit above their 13-week moving average (13W MA), but only 23 of 58 ETFs (40%, +24.1pp) beat the S&P 500 SPY, a 47pp gap. Small-cap, mid-cap, copper-linked equity, Taiwan, South Korea, and emerging markets EEM lead on a relative basis, while developed ex-US, low-volatility, and Russell Growth IWF lag. The equity tape shows a price advance with selective leadership.
Fixed income posted the strongest price-breadth improvement across our universe. As of June 12, 14 of 17 ETFs (82%, +29.4pp) sit above their 13W MA and 11 of 16 ETFs (69%, unchanged on the week) beat the Aggregate Bonds AGG. Credit, mortgages, munis, EM debt, and Long Treasuries TLT lead relative to the benchmark, while intermediate Treasuries lag. The bond move is a broad price recovery concentrated in credit and the long end rather than the Treasury belly.
As of June 12, 11 of 15 specialty ETFs (73%, unchanged on the week) sit above their 13W MA, but only 3 of 15 ETFs (20%, unchanged on the week) beat the S&P 500 SPY, a 53pp gap. Semiconductors, infrastructure, and momentum lead within specialty, while clean energy, gold, bitcoin proxies, and real estate lag; Copper CPER leads versus the S&P 500 SPY, and Oil USO sits below its 13W MA. The specialty and commodity mix concentrates strength in industrial hard assets rather than alternative assets or energy.
13-Week Intermediate Breadth
Key Takeaways
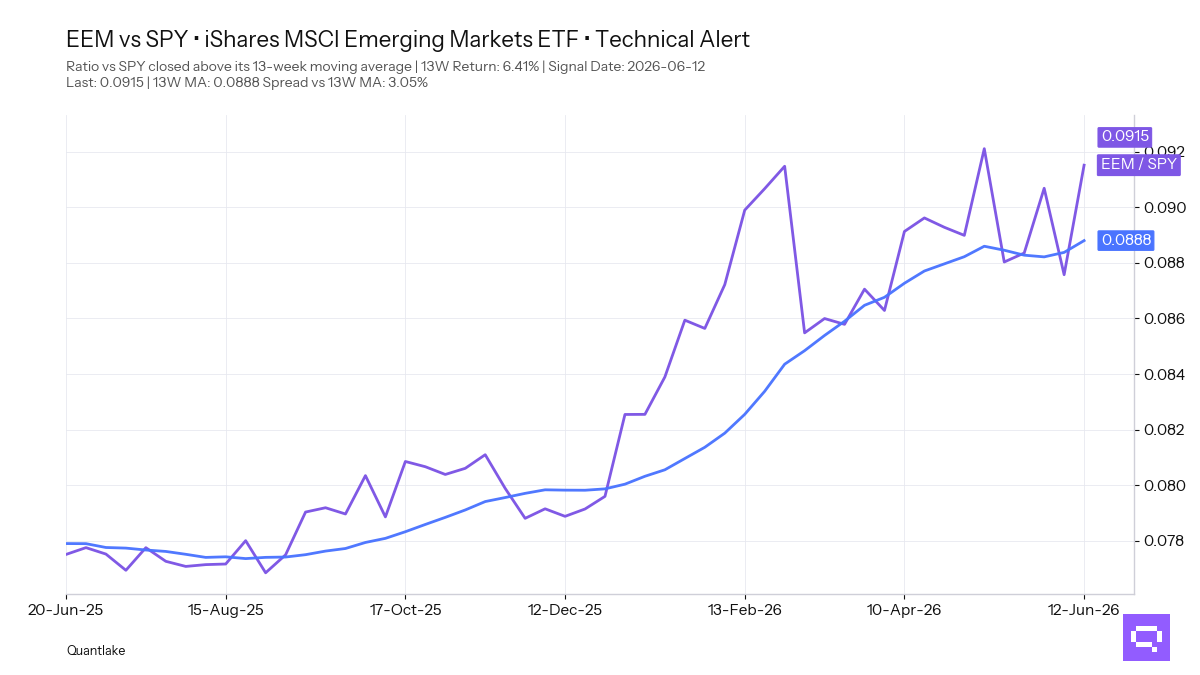
• Cross-timescale equity alignment sits at 76%. Taiwan, South Korea, small-cap, equal-weight, and copper-linked equity outperform the S&P 500 SPY across daily, weekly, and monthly windows. Germany, China, Brazil, and Russell Growth IWF lag. Emerging Markets EEM, with a +6.41% period relative return vs SPY, crossed above its 13-week ratio moving average vs SPY. The equity rotation favors cyclicals and smaller-cap beta over large-cap growth and developed-market defensives.
• Fixed-income cross-timescale alignment sits at 65%. International aggregate, EM debt, high-yield credit, investment grade, mortgages, and munis outperform the Aggregate Bonds AGG across timeframes. Government Treasuries lag. Corporate Credit VCIT, Long Treasuries TLT, Mortgage-Backed MBB, and TIPS TIP crossed above their 13W MA in the week just closed. Short TIPS VTIP crossed below its 13-week ratio moving average vs AGG after a +0.33% 13-week relative return. The bond distribution favors credit carry and duration extension over inflation-protected short duration.
• Specialty cross-timescale alignment sits at 80%. Momentum, infrastructure, and semiconductors are the only themes outperforming the S&P 500 SPY across timeframes. Gold, bitcoin proxies, managed futures, and low-volatility equity lag. Clean Energy ICLN crossed below its 13-week ratio moving average vs the S&P 500 SPY, with a +1.35% period relative return. Copper CPER crossed above its 13-week ratio moving average vs the S&P 500 SPY. Oil USO crossed below its 13W MA. The outside buckets reward industrial hard assets over defensive alternatives and energy.
FEATURED ETF: iShares MSCI Emerging Markets ETF EEM vs SPY
Other Technical Signal Events
EQUITY
↗ Price breakouts (cross-up 13W MA)
• JEPI - JPMorgan Equity Premium Income ETF · 13W perf: +0.4%
• XLY - Consumer Discretionary Select Sector · +5.4%
↘ Price breakdowns (cross-down 13W MA)
None for the week
↗ Leadership gains (cross-up 13W MA vs SPY)
• RSP - Invesco S&P 500® Equal Weight ETF · 13W relative perf: -2.2%
• DIA - SPDR Dow Jones Industrial Average ETF · -1.7%
• VO - Vanguard Mid-Cap · -1.3%
• QUAL - iShares MSCI USA Quality Factor ETF · -0.8%
• VT - Vanguard Total World Stock · unch.
• VEA - Vanguard FTSE Developed Markets · unch.
• COPX - Global X Copper Miners ETF · +0.2%
• MDYV - SPDR® S&P 400 Mid Cap Value ETF · +0.3%
• VB - Vanguard Small-Cap · +1.6%
• MDYG - SPDR® S&P 400 Mid Cap Growth ETF · +2.6%
• SLYV - SPDR® S&P 600 Small Cap Value ETF · +4.2%
• IJR - iShares Core S&P Small-Cap ETF · +5.0%
• SLYG - SPDR® S&P 600 Small Cap Growth ETF · +5.7%
• IWM - iShares Russell 2000 ETF · +6.0%
• EEM - iShares MSCI Emerging Markets ETF · +6.4%
↘ Leadership losses (cross-down 13W MA vs SPY)
• IWF - iShares Russell 1000 Growth ETF · 13W relative perf: -1.1%
FIXED INCOME
↗ Price breakouts (cross-up 13W MA)
• TLT - iShares 20+ Year Treasury Bond ETF · 13W perf: +0.3%
• MBB - iShares MBS ETF · +0.5%
• TIP - iShares TIPS Bond ETF · +0.7%
• VCIT - Vanguard Intermediate-Term Corporate Bond · +1.2%
↘ Price breakdowns (cross-down 13W MA)
None for the week
↗ Leadership gains (cross-up 13W MA vs AGG)
• TLT - iShares 20+ Year Treasury Bond ETF · 13W relative perf: -0.3%
• MBB - iShares MBS ETF · unch.
↘ Leadership losses (cross-down 13W MA vs AGG)
• VTIP - Vanguard Short-Term Inflation-Protected Securities · 13W relative perf: +0.3%
• TIP - iShares TIPS Bond ETF · +0.1%
SPECIALTY
↗ Price breakouts (cross-up 13W MA)
None for the week
↘ Price breakdowns (cross-down 13W MA)
None for the week
↗ Leadership gains (cross-up 13W MA vs SPY)
• PAVE - Global X U.S. Infrastructure Development ETF · 13W relative perf: +2.5%
↘ Leadership losses (cross-down 13W MA vs SPY)
• ICLN - iShares Global Clean Energy ETF · 13W relative perf: +1.3%
COMMODITIES
↗ Price breakouts (cross-up 13W MA)
None for the week
↘ Price breakdowns (cross-down 13W MA)
• USO - United States Oil Fund LP · 13W perf: +4.6%
↗ Leadership gains (cross-up 13W MA vs SPY)
• CPER - United States Copper LP · 13W relative perf: +1.1%
↘ Leadership losses (cross-down 13W MA vs SPY)
None for the week
Romain Gandon
CEO, Quantlake
Disclaimer: This article is for informational and educational purposes only and does not constitute investment advice. Past performance is not indicative of future results.