.png)

Sector Rotation: Health Care Holds the Lead
Utilities XLU led the week's downside as Health Care XLV topped the weekly standings.
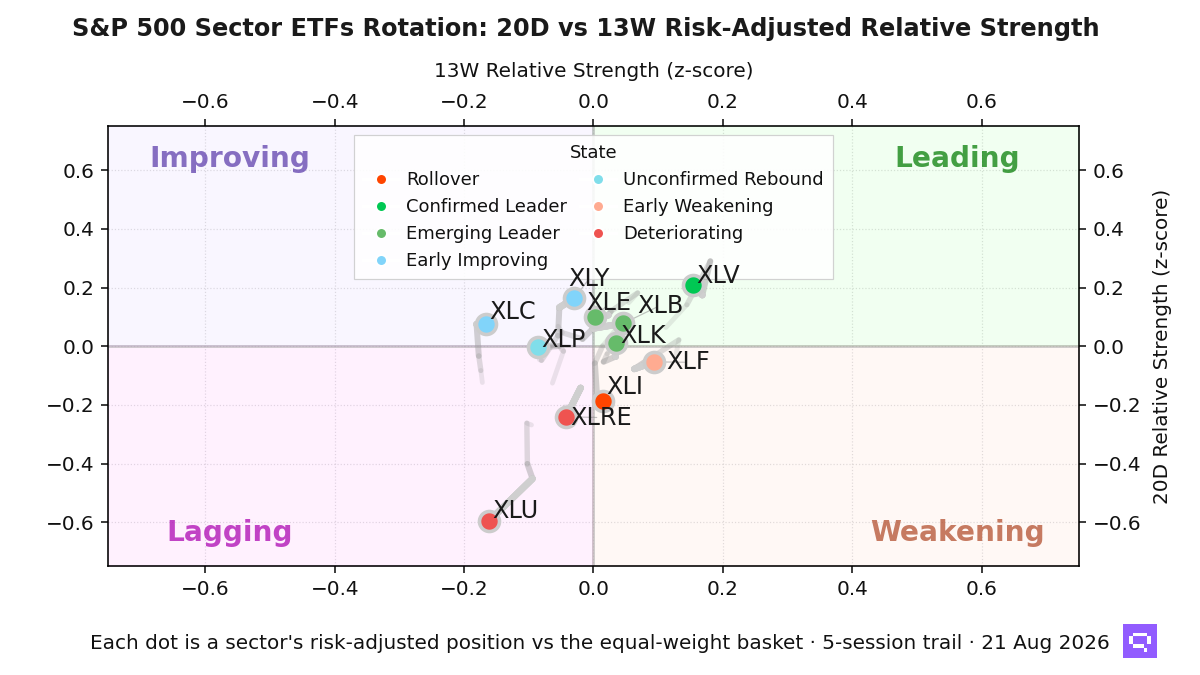
Sector selection pays near its average across the eleven S&P 500 sector ETFs; dispersion sits in a normal regime as of August 21. The z-score against its GARCH-normalised mean is -0.15, and the spread widened markedly over the past five sessions. The fresh expansion is transitional and mean-reversion-prone; relative motion between sectors is the active signal.
Consumer Discretionary XLY posted the strongest upside rotation and rose to fifth. Health Care XLV strengthened deeper into leadership and held first with a +0.88 weekly reading. Materials XLB rotated higher into third and keeps both horizons positive. Consumer Staples XLP rebounded to fourth from a lagging base, and Energy XLE holds second as its five-session rotation slipped against flat intermediate backing. The upside cluster mixes confirmed leadership with rebound flows from weaker bases.
Utilities XLU led the downside rotation, moving deeper into Lagging with the longest decline in the field and holding last at -0.78. Industrial XLI rolled over to tenth from Weakening and showed the sharpest fade outside Lagging. Financial XLF weakened alongside it, and Real Estate XLRE deteriorated from a lagging base to sixth. Technology XLK fell to ninth with a near-zero positive 13-week line, and Communication Services XLC improved tactically to seventh against strong negative intermediate backing. Six of the eleven sectors hold positive leadership states, and the split runs between tactical-recovery names with weak intermediate backing and deteriorating names that deepen lagging or weakening states.
Sector Rotation Map
Romain Gandon
CEO, Quantlake
Disclaimer: This article is for informational and educational purposes only and does not constitute investment advice. Past performance is not indicative of future results.