


.png)

Sector Momentum: Healthcare and Consumer Staples Are in Breakout
Defensive Rotation Joins Energy Leadership
Defensive sectors joined Energy in the upper tier this week. Five of the eleven S&P 500 sector ETFs are positive on 3M momentum as of October 16. Energy XLE leads at 19.0%, and the median reading is 0.0%. The 25.4-point spread leaves a wide gap across the field, with Real Estate XLRE last at -6.4%. Two sectors are in breakout, and one is in breakdown.
Energy XLE added 0.1pp over the week. Its -0.58 correlation to SPY is inverse, which gives the leader a hedge-like link inside the sector field. Healthcare XLV rose 3.5pp to 10.1% and is in breakout. Consumer Staples XLP turned positive at 3.5% after a 3.7-point jump and is in breakout.
Materials XLB 3M Momentum Turned Positive
Materials XLB turned positive at 1.2% after a 3.6-point jump. Its 0.37 beta is muted, which gives the new positive reading a low-amplitude profile. Communication Services XLC also turned positive, and three sectors turned positive this week.
Technology XLK fell 2.5pp to 4.6%, cooling the prior growth lead. Financials XLF has been negative since October 2, and Consumer Discretionary XLY is also below zero. Real Estate XLRE is in breakdown at -6.4% after a -0.8-point week. Its -0.12 correlation to SPY is weak, which leaves the laggard only lightly tied to the benchmark. Industrials XLI and Utilities XLU join XLRE below -5.0%, and three sectors sit under that mark.
Breakout: 3-month momentum above the group median and in the top half of the fund's own 1-year momentum range, after a weekly rise in momentum in the top quarter of the group.
Breakdown: 3-month momentum below the group median and in the bottom half of the fund's own 1-year momentum range, after a weekly fall in momentum in the bottom quarter of the group.
S&P 500 Sectors ETFs Heatmaps
S&P 500 Sectors ETFs 3M Momentum
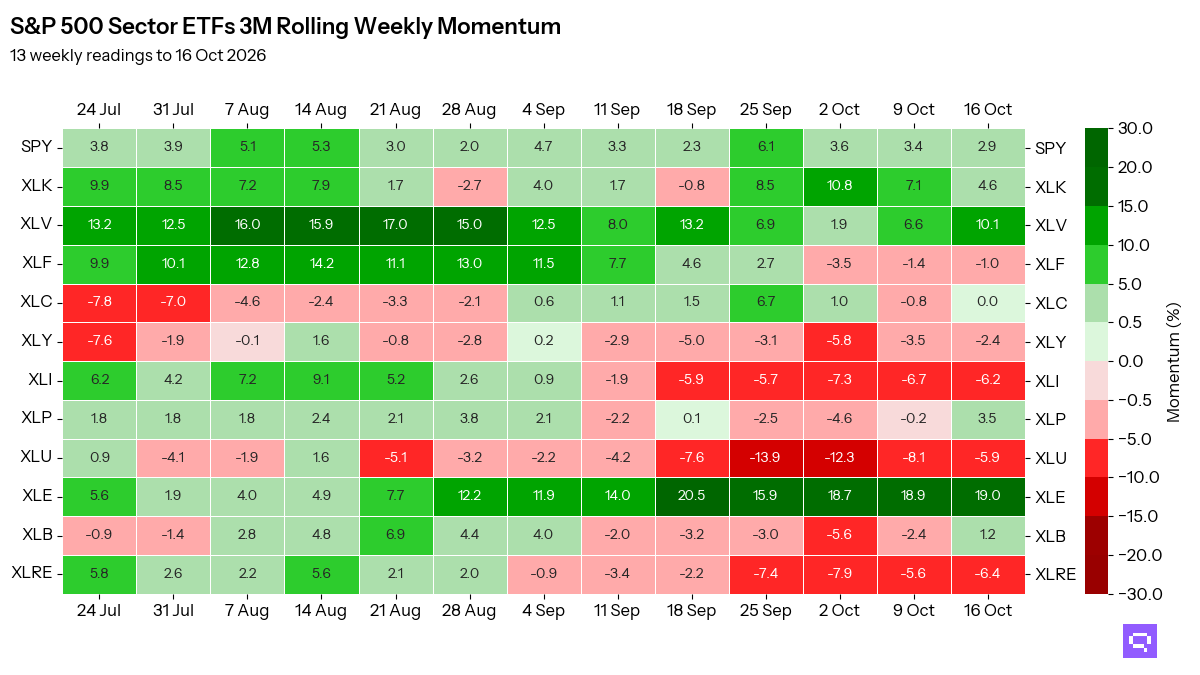
How to read: each cell is the ETF's price change over the previous 13 weeks, as of that week. Read across a row to see its momentum build or fade over the last 13 weeks; read down the last column to compare ETFs this week.
S&P 500 Sectors ETFs 3M Correlation vs SPY
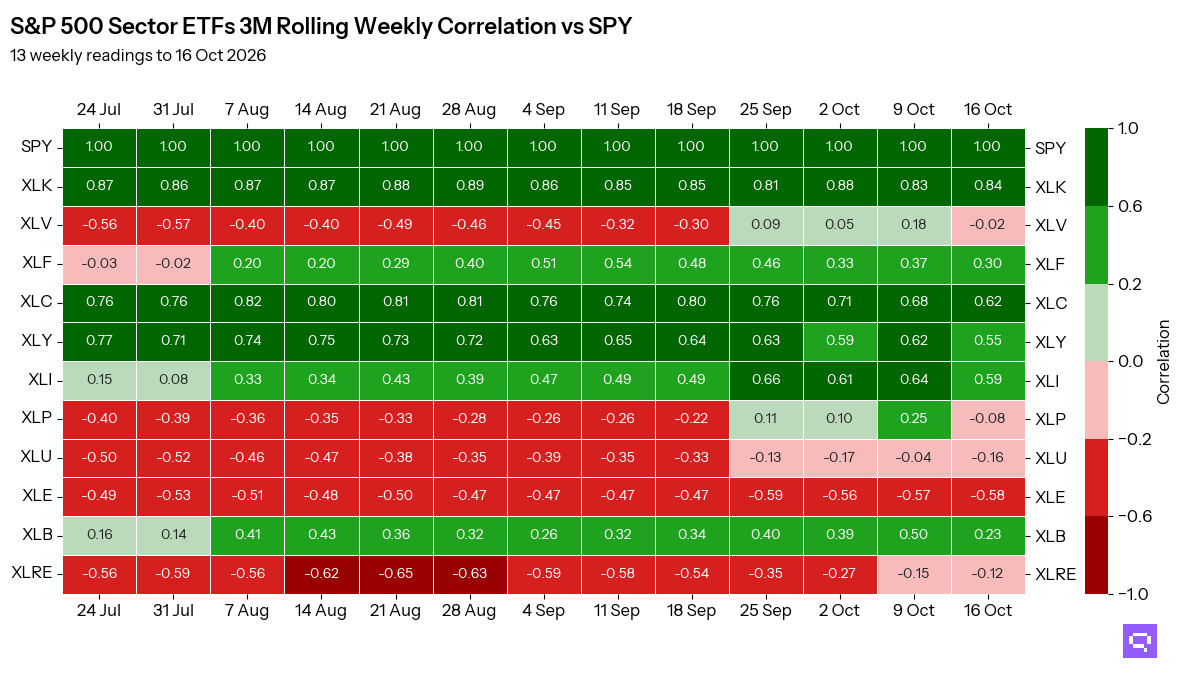
How to read: each cell is how closely the ETF's weekly returns moved in the same direction as SPY over the 13 weeks to that date: 1 moves with SPY, 0 moves independently, below 0 moves opposite. It says nothing about how far it moved.
S&P 500 Sectors ETFs 3M Beta vs SPY
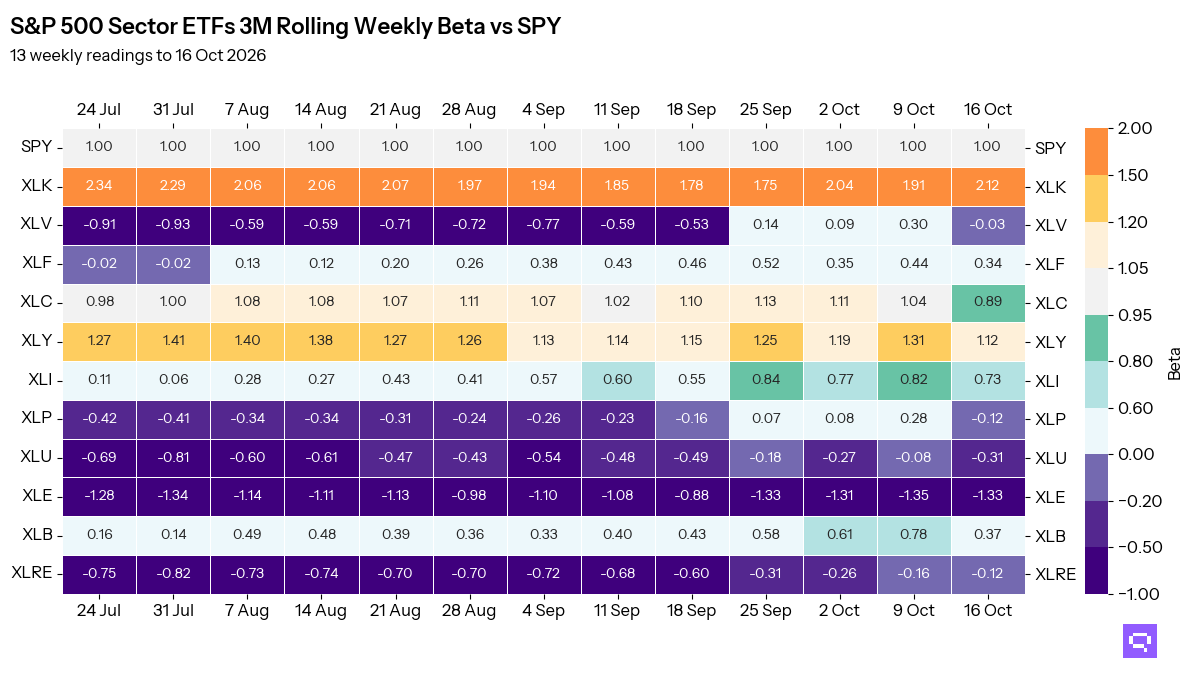
How to read: each cell is how far the ETF moved for each 1% move in SPY, over the same 13 weeks: 1.0 moves in line, 1.5 moves half as much again, 0.5 half as much. Read it with correlation: a high beta only describes the ETF's typical move when its correlation is high too.
Romain Gandon
CEO, Quantlake
Disclaimer: This article is for informational and educational purposes only and does not constitute investment advice. Past performance is not indicative of future results.


