Blurred image
April 26, 2026
2 min read

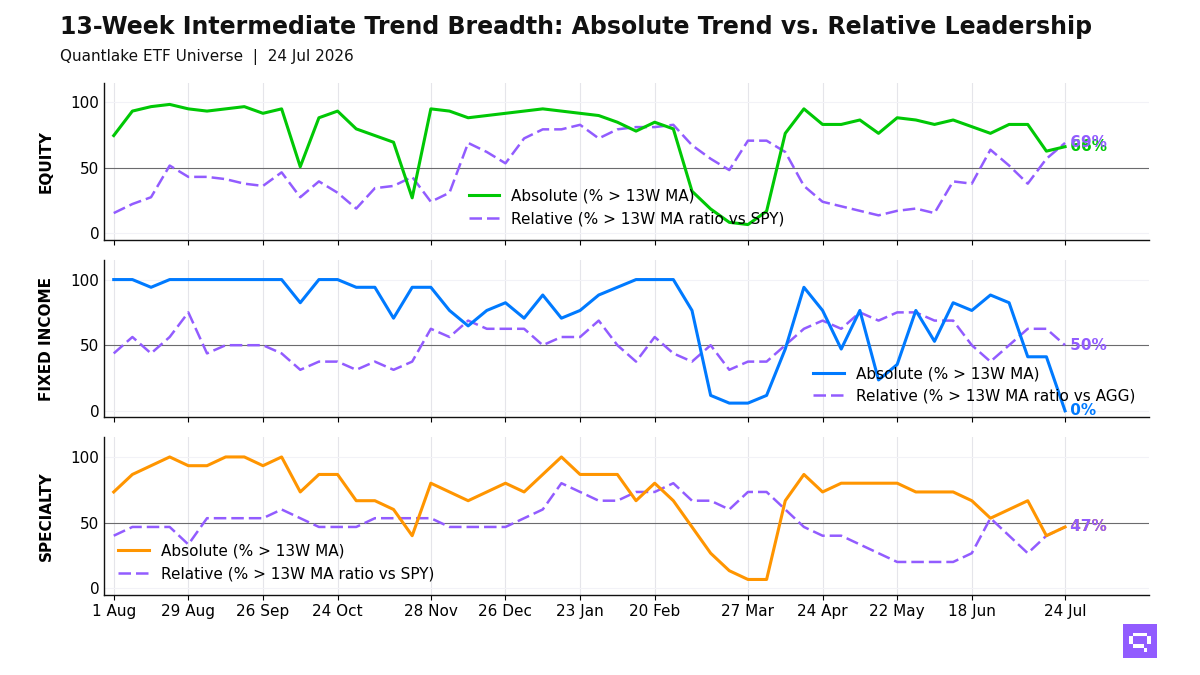
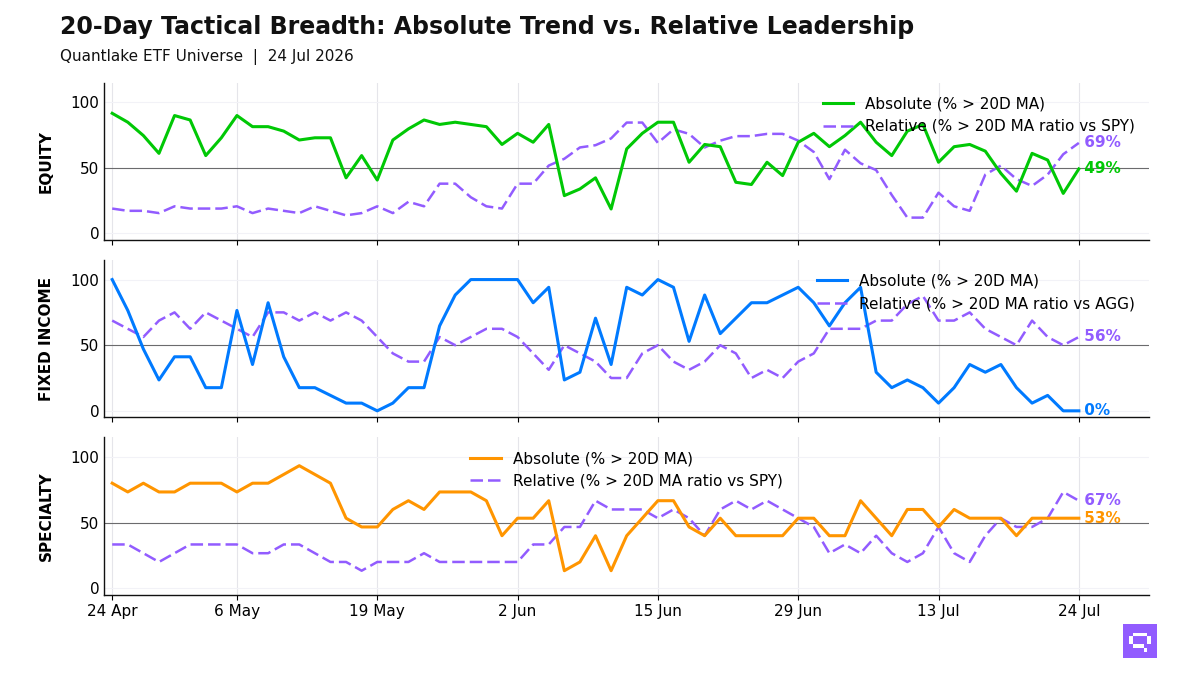
S&P 500 Sector Dynamics — Normal Regime | April 24, 2026

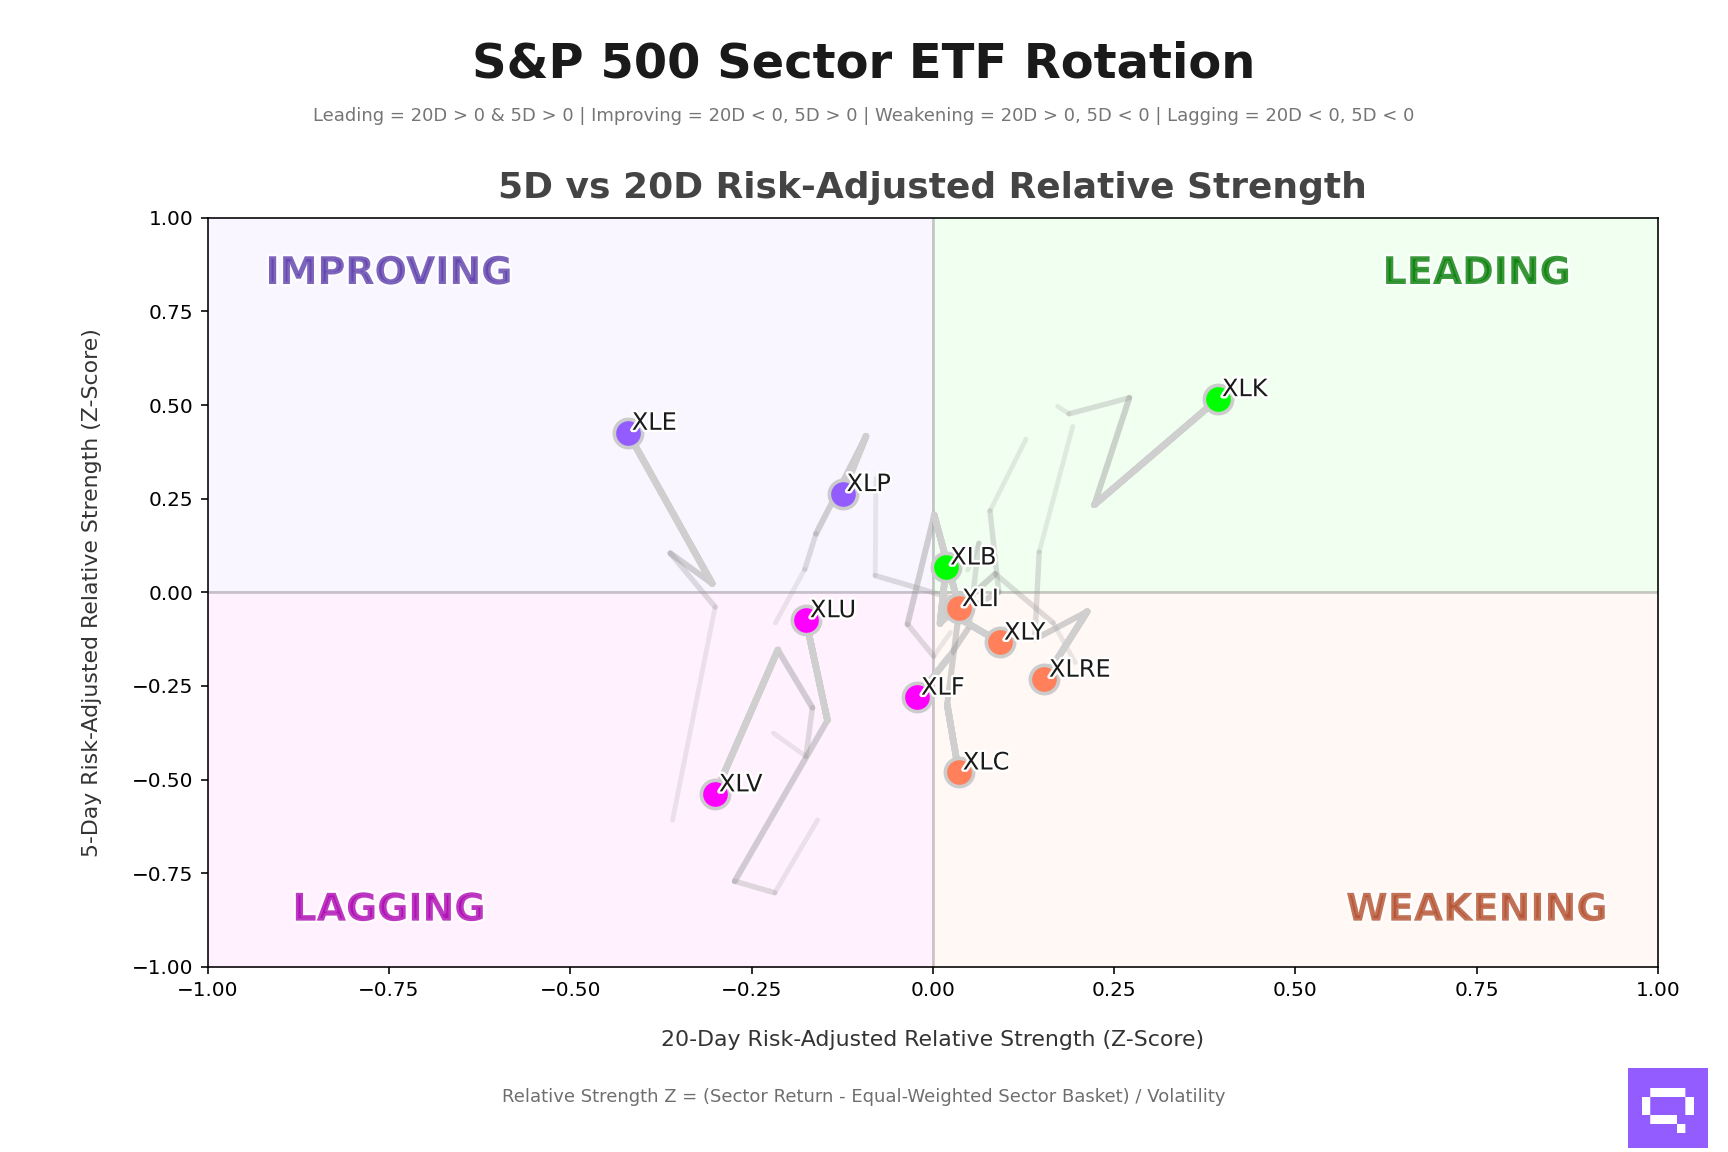
As of April 24, 2026, S&P 500 sector dispersion stands at a Z-score of +0.69 (Normal regime). Standard Rotation: Focus on velocity shifts between quadrants.

Sector Rotation Map

Quantlake Sector Snake Chart

Alpha Z: risk-adjusted relative strength vs the equal-weighted S&P 500 sector basket (Z-score). Velocity: rate of change in short-term relative strength (1D vs 5D Z-score delta — tactical momentum). Structural velocity: smoothed 5D vs 20D momentum delta, reflecting regime-level directional shifts.

Momentum Leaders

• Technology — Rank #1 | Alpha Z: +1.85 | Velocity: +1.34

• Materials — Rank #3 | Alpha Z: +0.35 | Velocity: +0.28

Rotation Warnings

• Industrial — Rank shift (1D vs 5D): -4 | Structural velocity: -0.08

• Communication Services — Rank shift (1D vs 5D): -1 | Structural velocity: -0.52

• Financial — Rank shift (1D vs 5D): +1 | Structural velocity: -0.26

Mean Reversion Candidates

• Utilities — Alpha Z: +0.33 | Velocity: +0.41

S&P 500 Sector ETF Alpha Intelligence

Risk-adjusted S&P 500 sector positioning relative to the equal-weighted sector universe

Each sector is evaluated using 20-day and 5-day risk-adjusted relative strength (Z-scores) versus the equal-weighted S&P 500 sector basket.

Sector 20D Rank 20D Z 5D Z Quadrant State
Technology (XLK) 1 0.39 0.52 Leading Confirmed Leader
Real Estate (XLRE) 2 0.15 -0.23 Weakening Strong Weakening
Consumer Discretionary (XLY) 3 0.09 -0.13 Weakening Early Weakening
Industrial (XLI) 4 0.04 -0.04 Weakening Early Weakening
Communication Services (XLC) 5 0.04 -0.48 Weakening Strong Weakening
Materials (XLB) 6 0.02 0.07 Leading Emerging Leader
Financial (XLF) 7 -0.02 -0.28 Lagging Neutral
Consumer Staples (XLP) 8 -0.12 0.26 Improving Strong Improving
Utilities (XLU) 9 -0.18 -0.07 Lagging Confirmed Laggard
Health Care (XLV) 10 -0.30 -0.54 Lagging Confirmed Laggard
Energy (XLE) 11 -0.42 0.43 Improving Strong Improving
How to read this table
20D Relative Strength (Z): Medium-term risk-adjusted outperformance versus the equal-weighted sector basket. Positive values indicate stronger structural positioning.
5D Relative Strength (Z): Short-term risk-adjusted outperformance versus the same benchmark. Positive values indicate stronger recent momentum.
20D Rank: Cross-sectional rank based on 20-day relative strength, with 1 = strongest sector.
Quadrant: Leading = 20D > 0 and 5D > 0; Improving = 20D < 0 and 5D > 0; Weakening = 20D > 0 and 5D < 0; Lagging = 20D < 0 and 5D < 0.
Positioning State: Internal classification that refines the quadrant view.
Confirmed Leader: Positive on both 20D and 5D, with top-tier 20D strength.
Emerging Leader: Positive on both horizons, but not yet among the strongest sectors on a 20D basis.
Strong Improving: Improving quadrant with clearly positive 5D strength.
Early Improving: Improving quadrant, but with a shallower early-stage move.
Strong Weakening: Weakening quadrant with clearly negative 5D strength.
Early Weakening: Weakening quadrant, but with a shallower early-stage fade.
Confirmed Laggard: Weak on both 20D and 5D, with poor structural rank.
Neutral: No strong directional signal.

Romain Gandon

CEO, Quantlake

Disclaimer: This report is for informational and educational purposes only and does not constitute investment advice.

Share this article on your favorite social network:

Discover more