.png)

Intermediate Trends: International Equity Leads as U.S. Growth Fades
Leadership tilts toward international and low-volatility equity
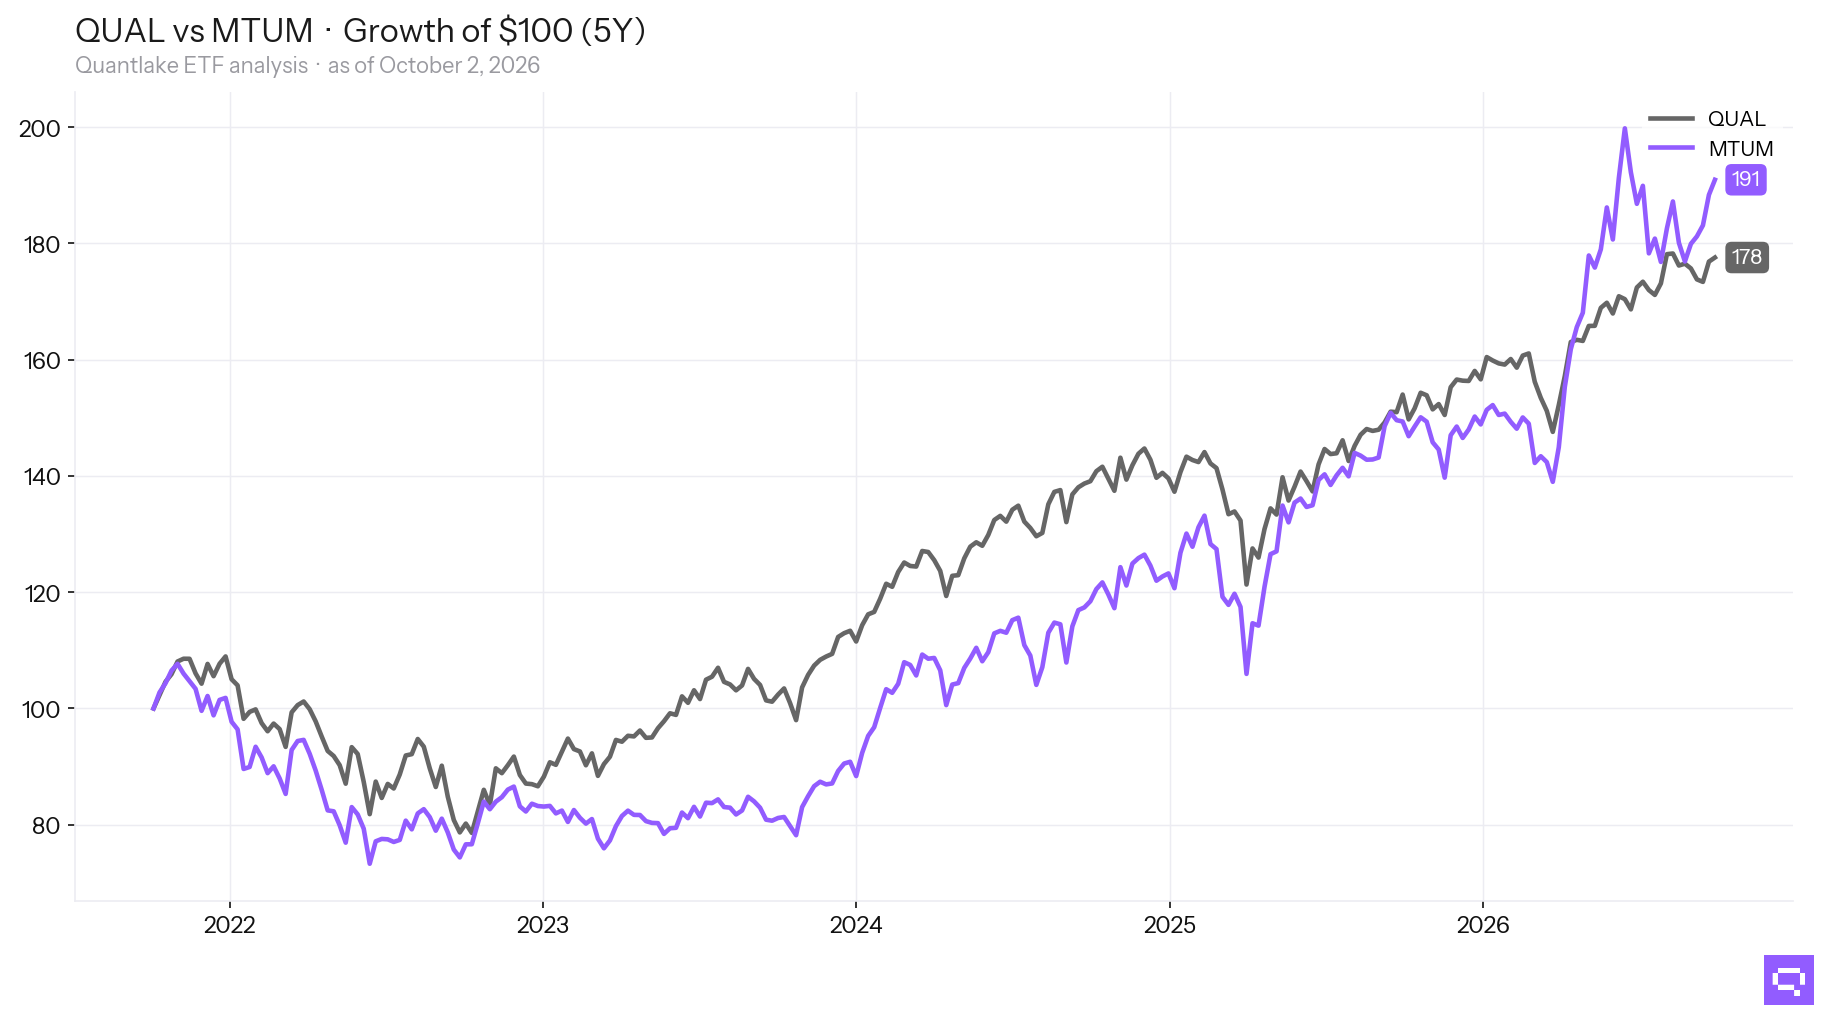
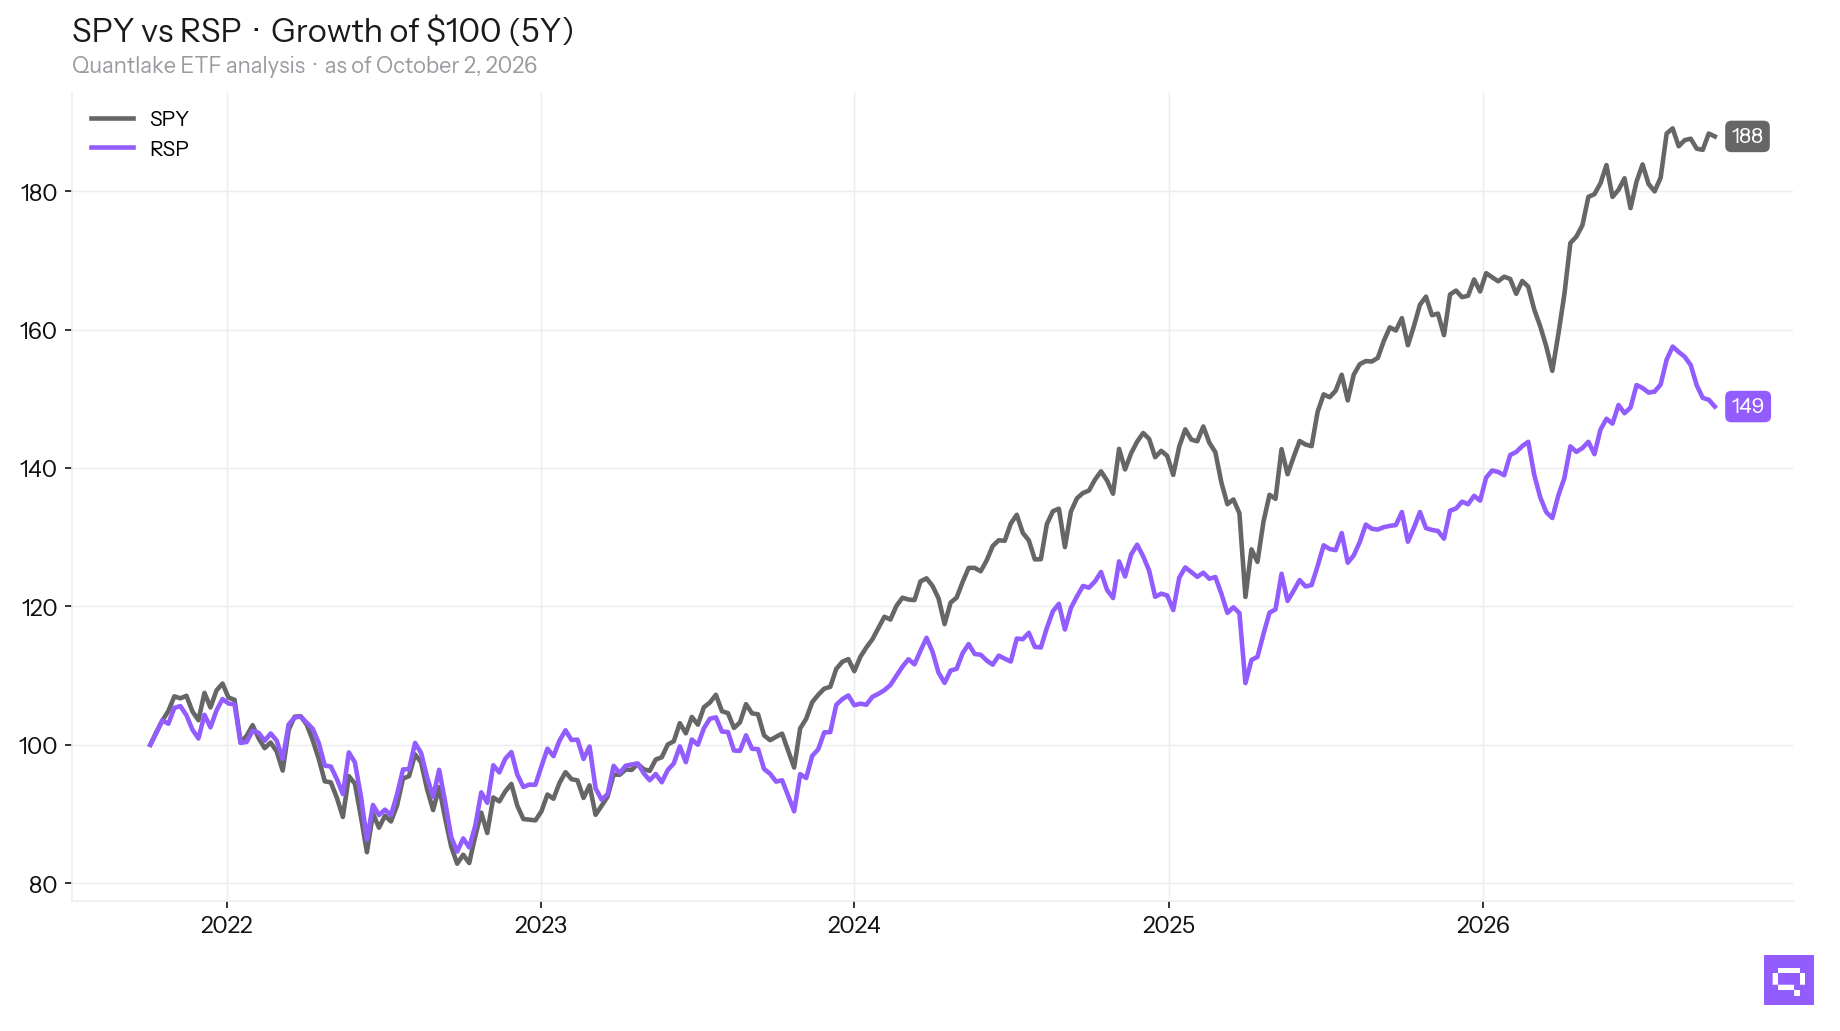
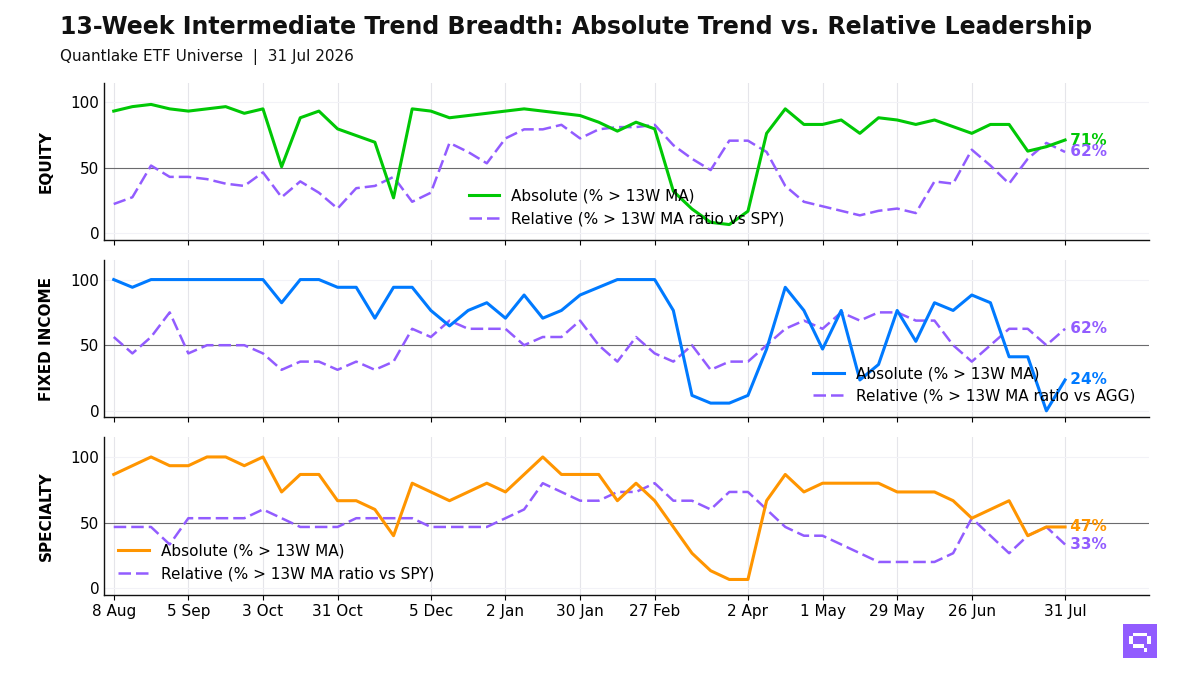
Developed ex-US and low-volatility equity lead across our ETF universe into the July 31 close, with 42 of 59 equity ETFs (71%, +5.1pp on the week) above their 13-week moving average (13W MA) and 36 of 58 (62%, -6.9pp) above their 13-week ratio moving average versus the S&P 500 SPY. Developed ex-US, low-volatility, and value populate the leadership side, with Germany EWG and India INDA on the upgrade list. U.S. growth, momentum, and EM Asia fill the laggard cluster. The equity configuration shows broad price participation and weaker benchmark-relative follow-through.
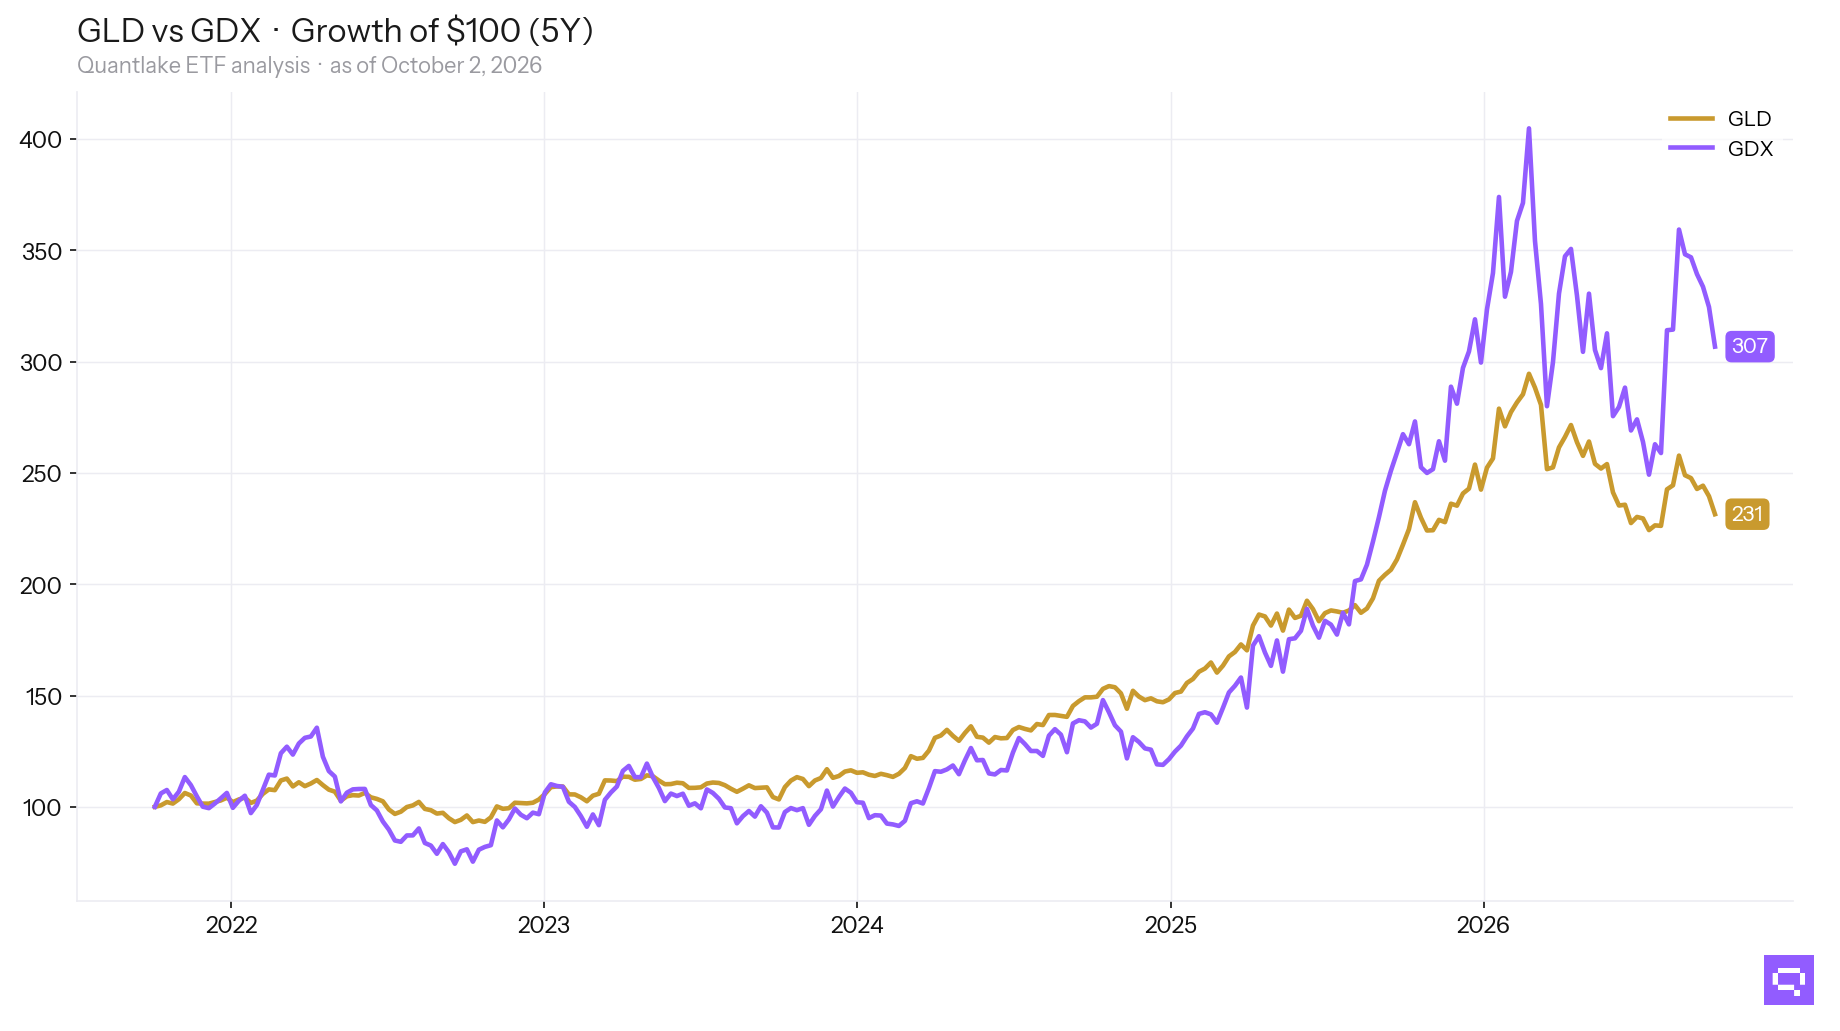
Fixed income leadership is limited to high-yield credit and short duration, with 4 of 17 bond ETFs above their 13W MA. Relative strength versus the Aggregate Bonds AGG concentrates in EM debt, TIPS, and intermediate credit. Long-duration Treasuries and mortgages lag. The bond cross-section favors spread sectors and lower rate sensitivity.
Specialty leadership is limited to low-volatility, real estate, and biotech, with 5 of 15 outperforming the S&P 500 SPY. Managed futures and crypto proxies lag on a relative basis. Commodity signals concentrate in oil, copper, and broad commodities, with silver on the lagging side. Specialty leadership is selective, and commodity strength concentrates in economically sensitive exposures.
13-Week Intermediate Breadth
Key Takeaways
Germany EWG, India INDA, and China MCHI crossed above both their 13W MA and their 13W ratio MA versus the S&P 500 SPY, yet they trail the benchmark by 0.64%, 2.45%, and 6.36% over 13 weeks. The international upgrade cluster marks early stabilization inside an underperformance base.
EM Sovereign Bonds EMB, TIPS TIP, and Corporate Credit VCIT crossed above their 13W ratio MA versus the Aggregate Bonds AGG. Mortgage-Backed MBB crossed below it, and High Yield HYG plus Short Corporate VCSH anchor the small price-above-MA group. Fixed income strength splits between spread sectors and shorter duration.
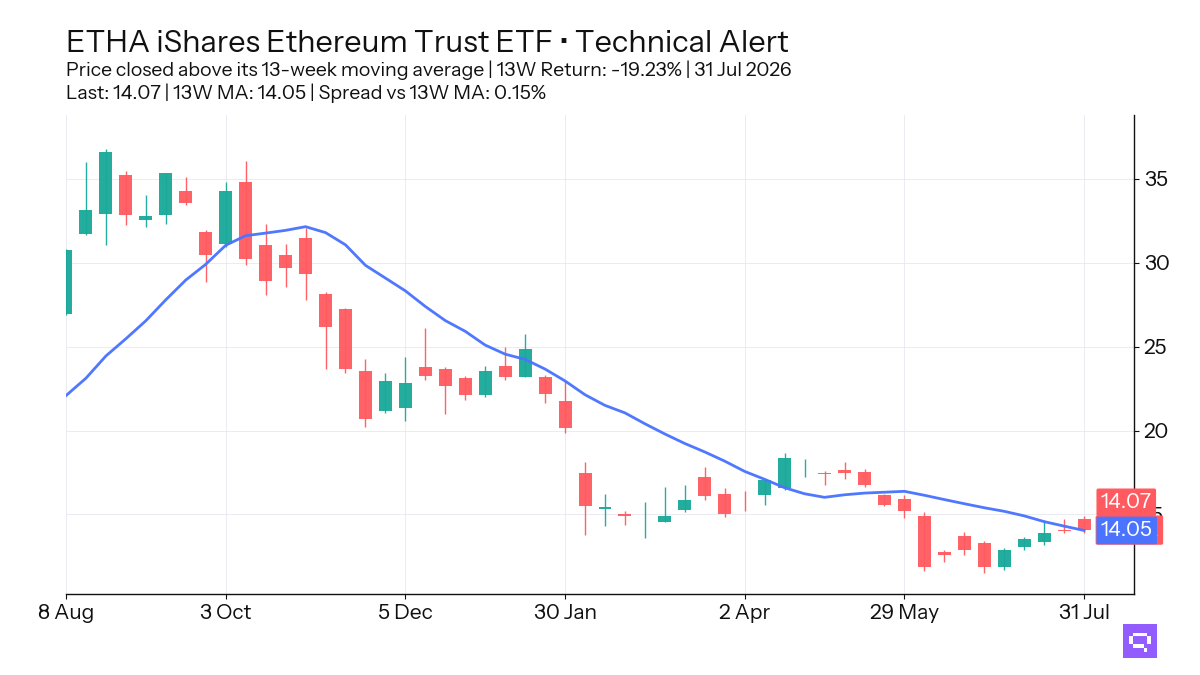
Ethereum Trust ETHA, down 19.23% over the trailing 13-week window, crossed above its 13-week moving average. Managed Futures DBMF lost its 13W ratio MA versus the S&P 500 SPY, and commodity alignment concentrates in oil, copper, and broad commodities, with silver on the lagging side. Specialty recovery and commodity strength are selective.
FEATURED ETF: iShares Ethereum Trust ETF ETHA
Other Technical Signal Events
Equity: Price vs 13-week MA
| Signal | Ticker | Name | 13W perf |
|---|---|---|---|
| Cross-up | MCHI | iShares MSCI China ETF | -2.7% |
| Cross-up | INDA | iShares MSCI India ETF | +1.4% |
| Cross-up | EWG | iShares MSCI Germany ETF | +3.3% |
| Cross-up | VT | Vanguard Total World Stock Index ETF | +3.3% |
| Cross-up | VEA | Vanguard FTSE Developed Markets Index ETF | +3.3% |
| Cross-up | VTI | Vanguard Total Stock Market Index ETF | +3.9% |
| Cross-up | EWJ | iShares MSCI Japan ETF | +5.2% |
| Cross-down | VLUE | iShares MSCI USA Value Factor ETF | +14.0% |
| Cross-down | MDYG | SPDR S&P 400 Mid Cap Growth ETF | +2.8% |
| Cross-down | IMTM | iShares MSCI Intl Momentum Factor ETF | +2.1% |
| Cross-down | XLB | Materials Select Sector | -1.4% |
| Cross-down | XLU | Utilities Select Sector | -4.1% |
Equity vs SPY: Price Ratio vs 13-week MA
| Signal | Ticker | Name | 13W rel perf |
|---|---|---|---|
| Cross-up | MCHI | iShares MSCI China ETF | -6.4% |
| Cross-up | INDA | iShares MSCI India ETF | -2.4% |
| Cross-up | EWG | iShares MSCI Germany ETF | -0.6% |
| Cross-down | VLUE | iShares MSCI USA Value Factor ETF | +9.7% |
| Cross-down | IWM | iShares Russell 2000 ETF | +0.6% |
| Cross-down | VTI | Vanguard Total Stock Market Index ETF | unch. |
| Cross-down | MDYG | SPDR S&P 400 Mid Cap Growth ETF | -1.1% |
| Cross-down | IMTM | iShares MSCI Intl Momentum Factor ETF | -1.8% |
| Cross-down | XLB | Materials Select Sector | -5.1% |
| Cross-down | XLU | Utilities Select Sector | -7.7% |
Fixed Income: Price vs 13-week MA
| Signal | Ticker | Name | 13W perf |
|---|---|---|---|
| Cross-up | VTIP | Vanguard Short-Term Inflation-Protected Securities Index ETF | -0.2% |
| Cross-up | HYG | iShares iBoxx $ High Yield Corporate Bond ETF | +0.2% |
| Cross-up | VCSH | Vanguard Short-Term Corporate Bond Index ETF | +0.3% |
| Cross-up | JNK | SPDR Bloomberg High Yield Bond ETF | +0.3% |
Fixed Income vs AGG: Price Ratio vs 13-week MA
| Signal | Ticker | Name | 13W rel perf |
|---|---|---|---|
| Cross-up | TIP | iShares TIPS Bond ETF | -0.4% |
| Cross-up | VCIT | Vanguard Intermediate-Term Corporate Bond Index ETF | unch. |
| Cross-up | EMB | iShares J.P. Morgan USD Emerging Markets Bond ETF | +0.8% |
| Cross-down | MBB | iShares MBS ETF | unch. |
Specialty: Price vs 13-week MA
| Signal | Ticker | Name | 13W perf |
|---|---|---|---|
| Cross-up | ETHA | iShares Ethereum Trust ETF | -19.2% |
| Cross-down | PAVE | Global X U.S. Infrastructure Development ETF | -0.4% |
Specialty vs SPY: Price Ratio vs 13-week MA
| Signal | Ticker | Name | 13W rel perf |
|---|---|---|---|
| Cross-down | DBMF | iMGP DBi Managed Futures Strategy ETF | -2.1% |
| Cross-down | PAVE | Global X U.S. Infrastructure Development ETF | -4.2% |
Romain Gandon
CEO, Quantlake
Disclaimer: This article is for informational and educational purposes only and does not constitute investment advice. Past performance is not indicative of future results.