


.png)

Intermediate Trends: Ex-US Equity Leads as U.S. Relative Strength Slips
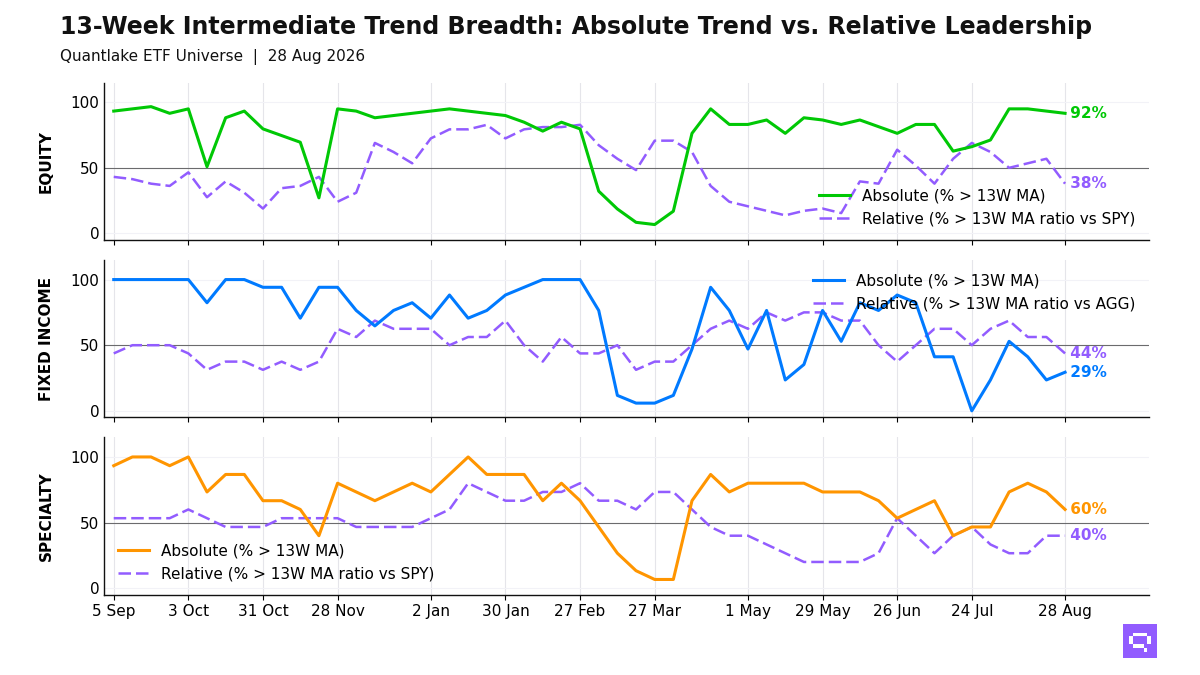
Price participation is broad; only 38% of equity ETFs beat the S&P 500 SPY.
Broad equity price participation masks a sharp relative contraction as of August 28: 54 of 59 equity ETFs (92%, -1.7pp on the week just closed) hold above their 13-week moving average (13W MA), but only 22 of 58 (38%, -19.0pp) hold above their 13-week ratio moving average vs the S&P 500 SPY, a 54pp price-relative gap.
Low-volatility, developed ex-US, and selected China and Taiwan exposures lead on a benchmark-relative basis, while U.S. broad market, size, dividend, and momentum cohorts fill the laggard cluster. Equity prices are broad; benchmark-relative leadership is selective.
Fixed income leadership is limited to 7 of 16 ETFs above their 13W ratio MA vs the Aggregate Bonds AGG, concentrated in high-yield credit, Preferred Stock PFF, and short duration. Long duration, investment grade, EM debt, and TIPS lag. Bond participation concentrates in credit and short duration. Duration strength is limited to defensive relative pockets.
Specialty leadership clusters in gold, biotech, and bitcoin on both price and relative measures vs the S&P 500 SPY, while real estate and clean energy fill the laggard cluster. Oil, broad commodities, and agriculture lead the commodity bucket. Copper CPER crossed below its 13W ratio MA vs the S&P 500 SPY. Strength outside core equity concentrates in hard assets and digital assets.
13-Week Intermediate Breadth
Key Takeaways
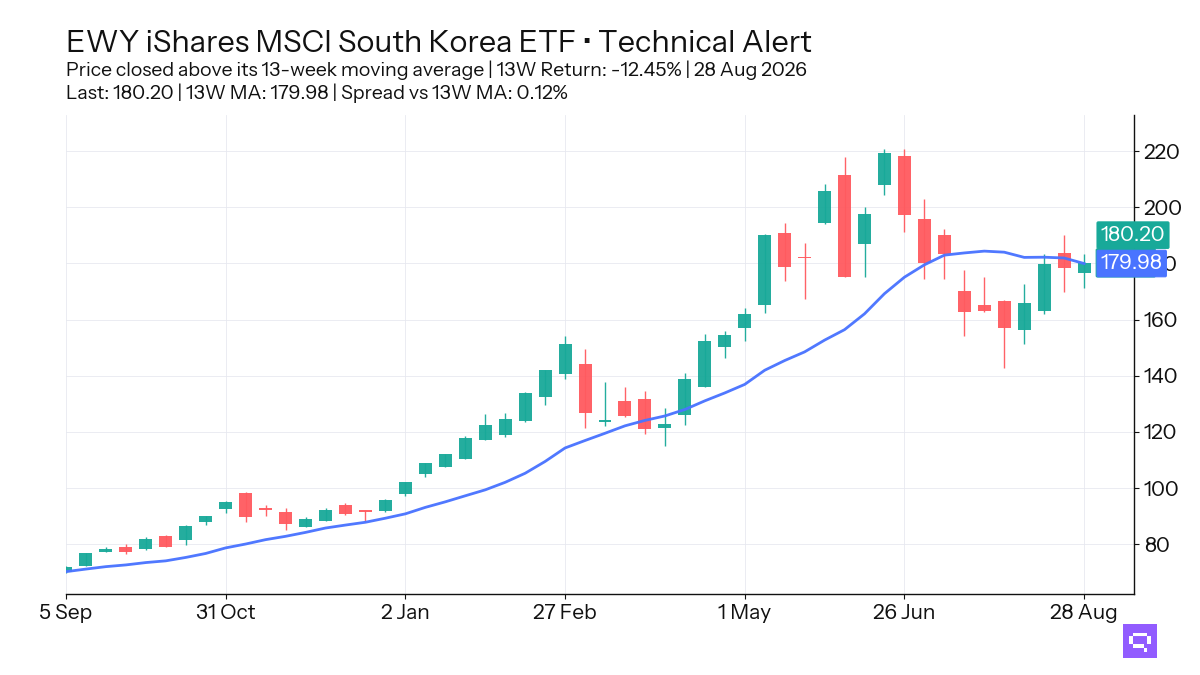
South Korea EWY, down 12.45% over the trailing 13-week window, crossed above its 13-week moving average. Taiwan EWT crossed above its 13W ratio MA versus the S&P 500 SPY, and Communication Services XLC crossed above its 13W ratio MA versus SPY. The regional picture separates price recovery from relative leadership.
Preferred Stock PFF crossed above its 13W MA. Intermediate Treasuries VGIT and TIPS TIP crossed below their 13W ratio MA versus the Aggregate Bonds AGG, while high-yield credit aligns across daily, weekly, and monthly relative measures through HYG and JNK. Bond leadership favors credit spread exposure, and duration strength is confined to defensive pockets.
Managed futures and option-income specialty funds hold above their 13W MA and lag the S&P 500 SPY on a relative basis. Global REITs REET and Real Estate VNQ crossed below their 13W MA, and Copper CPER crossed below its 13W ratio MA versus the S&P 500 SPY. Specialty and commodity strength concentrates in hard assets, digital assets, and energy-linked exposures.
FEATURED ETF: iShares MSCI South Korea ETF EWY
Other Technical Signal Events
Equity: Price vs 13-week MA
| Signal | Ticker | Name | 13W perf |
|---|---|---|---|
| Cross-up | EWY | iShares MSCI South Korea ETF | -12.5% |
| Cross-up | QQQ | Invesco QQQ | -2.9% |
| Cross-down | SLYG | SPDR S&P 600 Small Cap Growth ETF | +4.9% |
| Cross-down | XLRE | The Real Estate Select Sector | +2.0% |
| Cross-down | MDYG | SPDR S&P 400 Mid Cap Growth ETF | -0.3% |
Equity vs SPY: Price Ratio vs 13-week MA
| Signal | Ticker | Name | 13W rel perf |
|---|---|---|---|
| Cross-up | XLC | Communication Services Select Sector | -4.0% |
| Cross-up | EWT | iShares MSCI Taiwan ETF | +3.0% |
| Cross-down | DVY | iShares Select Dividend ETF | +4.5% |
| Cross-down | SDY | SPDR S&P Dividend ETF | +4.2% |
| Cross-down | JEPI | JPMorgan Equity Premium Income ETF | +3.2% |
| Cross-down | VO | Vanguard Mid-Cap Index ETF | +2.8% |
| Cross-down | VIG | Vanguard Dividend Appreciation Index ETF | +2.0% |
| Cross-down | QUAL | iShares MSCI USA Quality Factor ETF | +2.0% |
| Cross-down | VYM | Vanguard High Dividend Yield Index ETF | +1.8% |
| Cross-down | VB | Vanguard Small-Cap Index ETF | +0.8% |
| Cross-down | VEA | Vanguard FTSE Developed Markets Index ETF | +0.4% |
| Cross-down | VT | Vanguard Total World Stock Index ETF | +0.2% |
| Cross-down | VTI | Vanguard Total Stock Market Index ETF | +0.2% |
| Cross-down | IMTM | iShares MSCI Intl Momentum Factor ETF | unch. |
| Cross-down | VLUE | iShares MSCI USA Value Factor ETF | unch. |
Fixed Income: Price vs 13-week MA
| Signal | Ticker | Name | 13W perf |
|---|---|---|---|
| Cross-up | PFF | iShares Preferred and Income Securities ETF | -1.9% |
Fixed Income vs AGG: Price Ratio vs 13-week MA
| Signal | Ticker | Name | 13W rel perf |
|---|---|---|---|
| Cross-down | VGIT | Vanguard Intermediate-Term Treasury Index ETF | +0.1% |
| Cross-down | TIP | iShares TIPS Bond ETF | -0.5% |
Specialty: Price vs 13-week MA
| Signal | Ticker | Name | 13W perf |
|---|---|---|---|
| Cross-down | VNQ | Vanguard Real Estate Index ETF | +2.5% |
| Cross-down | REET | iShares Global REIT ETF | +2.2% |
Commodities vs SPY: Price Ratio vs 13-week MA
| Signal | Ticker | Name | 13W rel perf |
|---|---|---|---|
| Cross-down | CPER | United States Copper LP | +0.1% |
Romain Gandon
CEO, Quantlake
Disclaimer: This article is for informational and educational purposes only and does not constitute investment advice. Past performance is not indicative of future results.


