.png)
Friday Close Shows Ex-U.S. and Defensive Rotation
SUMMARY
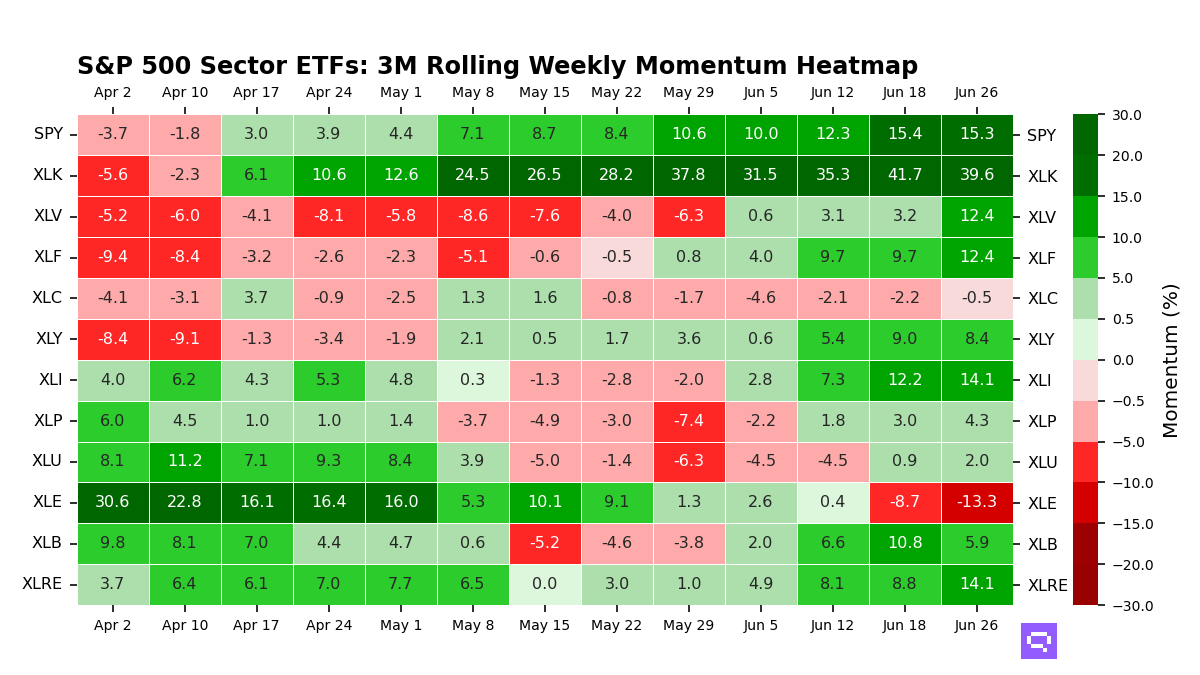
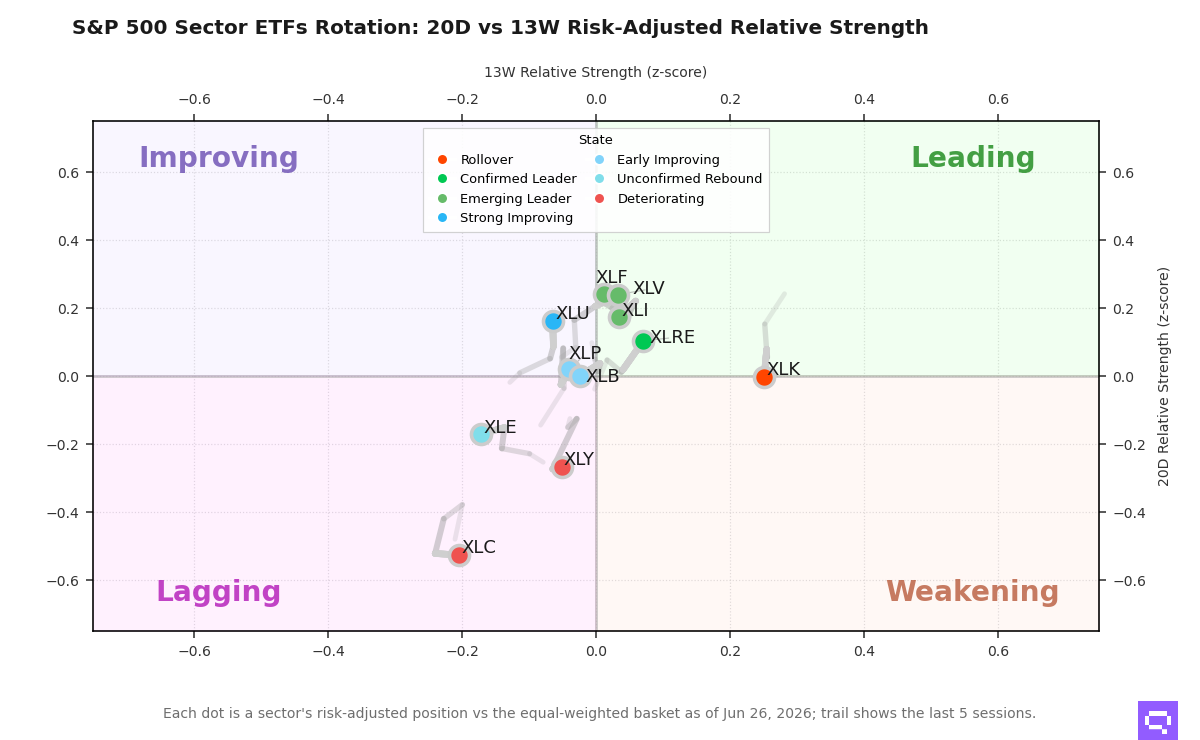
At Friday's close, leadership within our ETF universe rotated away from U.S.-centric risk and toward ex-U.S. equities, defensives, and higher-quality rate-sensitive pockets. The clearest relative strength improvement came from developed international, emerging markets, China, real estate, and consumer staples versus SPY, though in most cases the 20-day return profile still points to stabilization rather than established leadership. Offsetting that, consumer discretionary lost relative ground, while high yield credit, TIPS, and bitcoin also slipped on a relative basis after prior strength. The broad message is a short-horizon shift in leadership rather than a fully formed risk-on or risk-off regime change, with conviction capped by the fact that most upside ratio moves are emerging from negative trailing relative performance.
KEY TAKEAWAYS
- Ex-U.S. equity ETFs drove the upside rotation, with developed markets, emerging markets, and China improving versus SPY.
- Defensive and rate-sensitive equity groups also firmed relatively, led by staples and REIT exposure within our ETF coverage.
- Confirmation is incomplete: most relative breakouts reflect early repair, while prior leaders in discretionary, crypto, and high yield are fading.
BOTTOM LINE
We would read Friday's tape as an early broadening away from U.S. leadership and toward more defensive or non-U.S. exposure. Even so, the 20-day return backdrop argues for measured conviction until more of these relative gains turn from stabilization into sustained outperformance.
TECHNICAL SIGNAL EVENTS
ABSOLUTE PRICE SIGNALS
None
RELATIVE STRENGTH SIGNALS
Above 20D moving average:
EEM / SPY - iShares MSCI Emerging Markets ETF
Ratio: 0.0871 | 20D Relative Return: -4.83%
EFA / SPY - iShares MSCI EAFE ETF
Ratio: 0.1479 | 20D Relative Return: -3.97%
FXI / SPY - iShares China Large-Cap ETF
Ratio: 0.0550 | 20D Relative Return: +0.86%
IMTM / SPY - iShares MSCI Intl Momentum Factor ETF
Ratio: 0.0732 | 20D Relative Return: -4.96%
IQLT / SPY - iShares MSCI Intl Quality Factor ETF
Ratio: 0.0704 | 20D Relative Return: -3.01%
MBB / AGG - iShares MBS ETF
Ratio: 0.9551 | 20D Relative Return: -0.03%
MCHI / SPY - iShares MSCI China ETF
Ratio: 0.0865 | 20D Relative Return: +0.14%
VEA / SPY - Vanguard FTSE Developed Markets
Ratio: 0.0979 | 20D Relative Return: -4.53%
VGK / SPY - Vanguard FTSE Europe
Ratio: 0.1253 | 20D Relative Return: -4.49%
VNQ / SPY - Vanguard Real Estate ETF
Ratio: 0.1372 | 20D Relative Return: -0.86%
VT / SPY - Vanguard Total World Stock
Ratio: 0.2123 | 20D Relative Return: -1.53%
VWO / SPY - Vanguard FTSE Emerging Markets
Ratio: 0.0828 | 20D Relative Return: -2.53%
XLP / SPY - Consumer Staples Select Sector
Ratio: 0.1290 | 20D Relative Return: -1.42%
XLRE / SPY - SPDR Real Estate Select ETF
Ratio: 0.0631 | 20D Relative Return: -0.87%
Below 20D moving average:
HYG / AGG - iShares iBoxx $ High Yield Corporate Bond ETF
Ratio: 0.7989 | 20D Relative Return: +0.53%
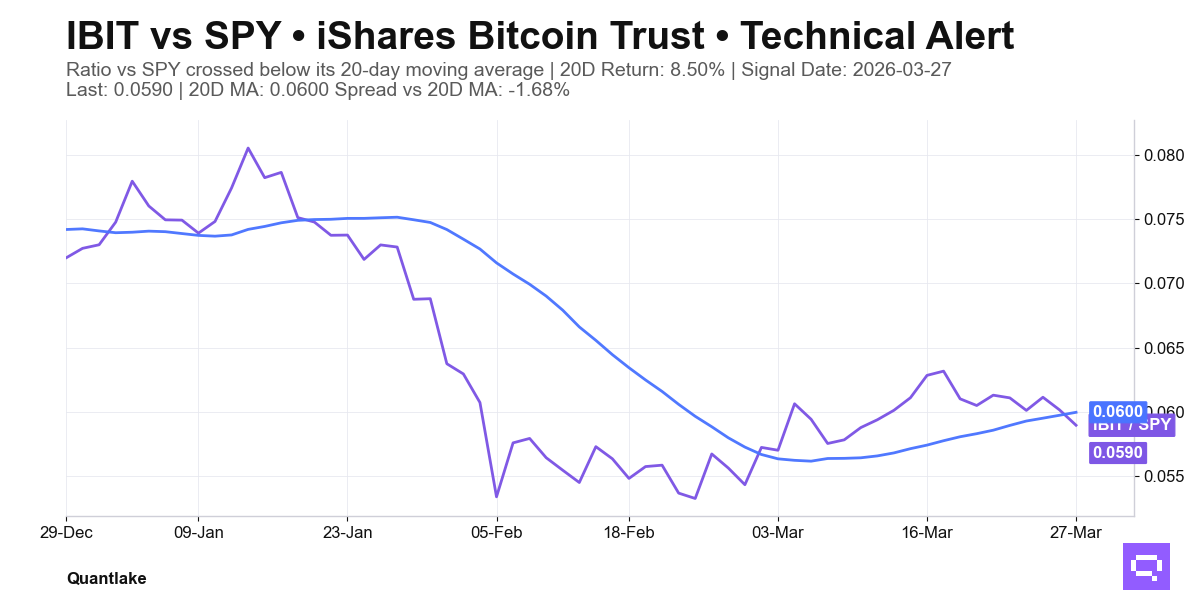
IBIT / SPY - iShares Bitcoin
Ratio: 0.0590 | 20D Relative Return: +8.50%
JNK / AGG - SPDR® Bloomberg High Yield Bond ETF
Ratio: 0.9606 | 20D Relative Return: +0.39%
TIP / AGG - iShares TIPS Bond ETF
Ratio: 1.1129 | 20D Relative Return: +0.56%
XLY / SPY - Consumer Discretionary Select Sector
Ratio: 0.1667 | 20D Relative Return: -2.24%