.png)
Daily Tactical: US Growth Carries as Equity Leadership Narrows
Price held up while relative leadership kept thinning
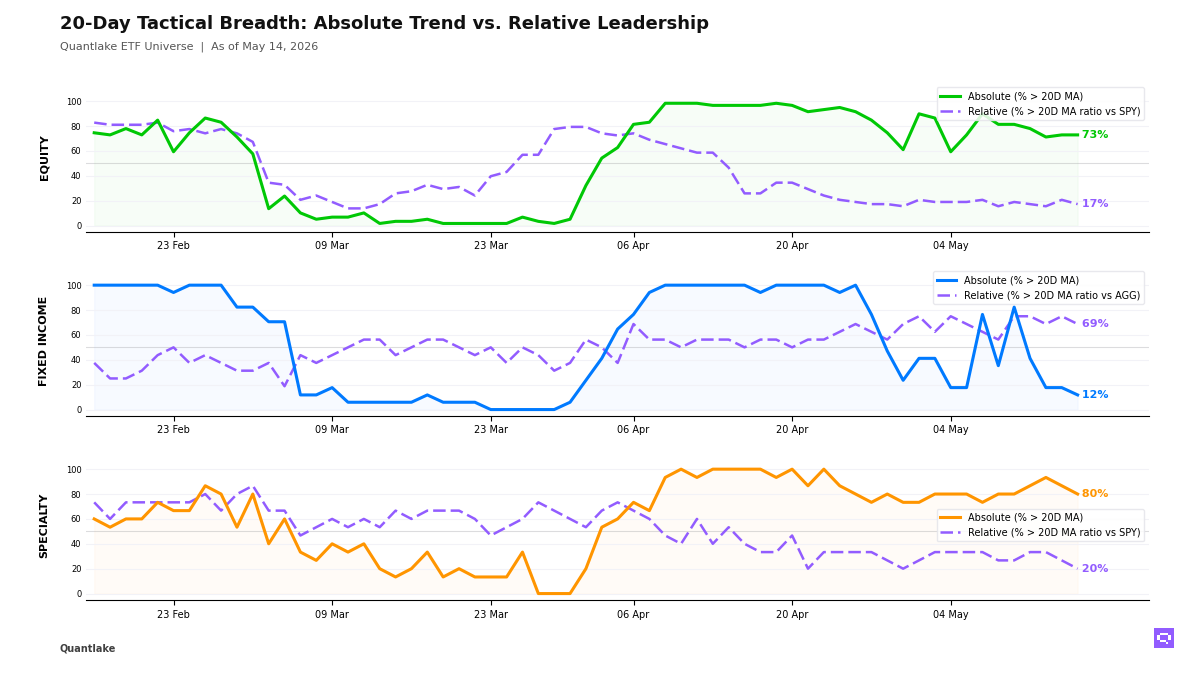
At the close, our equity tape looked firmer in price than in leadership. US growth and technology carried the relative advance, while developed ex-US, low-volatility and parts of Asia lost ground. Across our universe, 43 of 59 ETFs (73%, unchanged on the day) held above their 20-day moving average, but only 10 of 58 ETFs (17%, -3.5pp) beat the S&P 500 SPY, leaving a +56pp gap. That marks an increasingly selective tape, with price recoveries in developed ex-US, China, Japan, low-volatility, quality and value still failing to translate into relative leadership.
By the end of the day, fixed income had shifted more clearly into defensive rotation. Just 2 of 17 ETFs (12%, -5.9pp) held above their 20-day moving average, while 11 of 16 ETFs (69%, -6.2pp) still outperformed the Aggregate Bonds AGG, leaving a -57pp gap. Credit, munis and short-duration held up better than benchmark even as Treasuries, mortgage-backed exposure and long duration stayed under pressure.
Within specialty, price participation stayed high but leadership kept thinning: 12 of 15 ETFs (80%, -6.7pp) held above their 20-day moving average, yet only 3 of 15 ETFs (20%, -6.7pp) beat the S&P 500 SPY, a +60pp gap led by semiconductors, momentum and clean energy while gold-linked and income-oriented names failed to confirm. In commodities, Broad Commodities PDBC and Agriculture Basket DBA both crossed below their ratio moving averages versus the S&P 500 SPY, even as oil and copper remain the stronger themes across that specialty.
20-Day Tactical Breadth
Key Takeaways
• Technology, Taiwan, South Korea and emerging markets still hold multi-horizon relative leadership, but the latest equity event flow did not broaden that leadership. Communication Services XLC and S&P SmallCap Growth SLYG crossed above their 20-day moving averages, while Japan EWJ and China Large Cap FXI both crossed below their 20-day ratio moving averages versus the S&P 500 SPY.
• The bond tape is a duration split more than a credit breakdown. TIPS TIP crossed below its 20-day moving average and Mortgage-Backed MBB crossed below its 20-day ratio moving average versus the Aggregate Bonds AGG, while cross-timescale relative leaders still sit in EM debt, high yield, munis, preferred and short duration. That points to stability rather than a broad bond recovery.
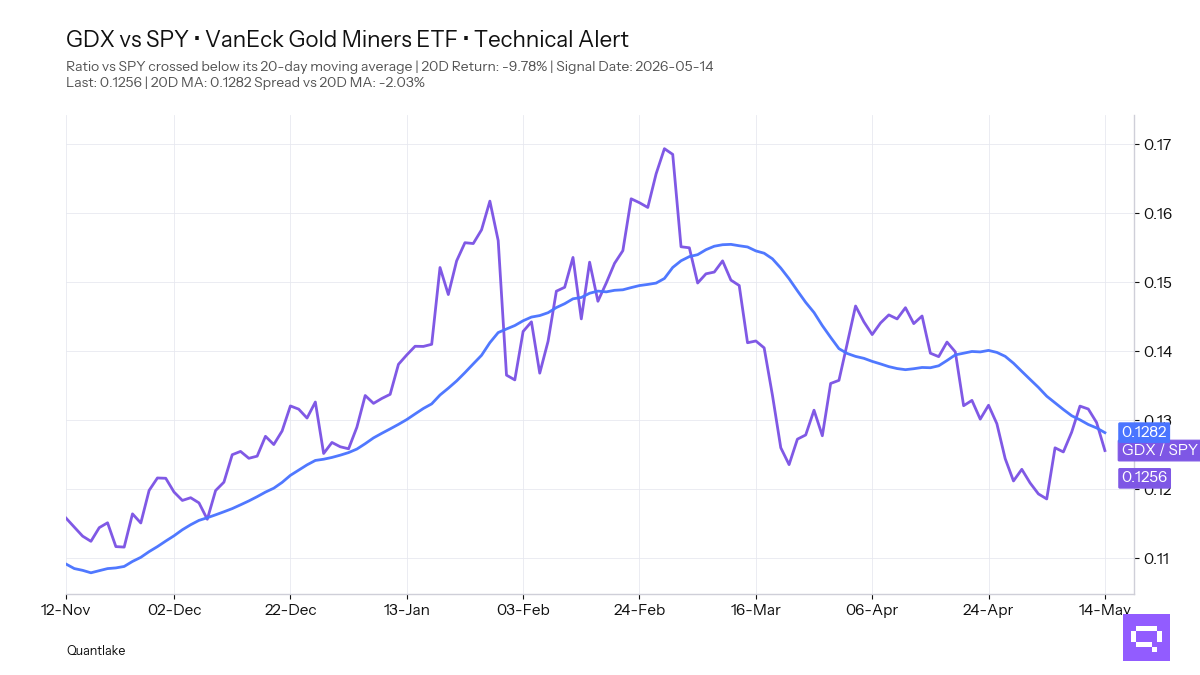
• Hard-asset leadership weakened further in specialty and commodities. Gold Miners GDX with a -9.78% period relative return versus SPY crossed below its 20-day ratio moving average. Gold GLD also crossed below its 20-day moving average, while Broad Commodities PDBC and Agriculture Basket DBA lost relative ground versus the S&P 500 SPY even though oil and copper remain the stronger commodity themes across timescales.
FEATURED ETF — VanEck Gold Miners ETF GDX vs SPY
Other Technical Signal Events
EQUITY
↗ Price breakouts (cross-up 20D MA)
• XLC - Communication Services Select Sector · 20D perf: -1.45%
• ACWV - iShares MSCI Global Min Vol Factor ETF · unch.
• SLYG - SPDR® S&P 600 Small Cap Growth ETF · +3.46%
↘ Price breakdowns (cross-down 20D MA)
• XLY - Consumer Discretionary Select Sector · 20D perf: +0.88%
• XLRE - SPDR Real Estate Select ETF · +0.23%
• XLB - Materials Select Sector · -0.15%
↗ Leadership gains (cross-up 20D MA vs SPY)
None on the close
↘ Leadership losses (cross-down 20D MA vs SPY)
• EWJ - iShares MSCI Japan ETF · 20D relative perf: -3.44%
• FXI - iShares China Large-Cap ETF · -6.19%
FIXED INCOME
↗ Price breakouts (cross-up 20D MA)
None on the close
↘ Price breakdowns (cross-down 20D MA)
• TIP - iShares TIPS Bond ETF · 20D perf: +0.34%
↗ Leadership gains (cross-up 20D MA vs AGG)
None on the close
↘ Leadership losses (cross-down 20D MA vs AGG)
• MBB - iShares MBS ETF · 20D relative perf: -0.17%
SPECIALTY
↗ Price breakouts (cross-up 20D MA)
None on the close
↘ Price breakdowns (cross-down 20D MA)
• GLD - SPDR® Gold · 20D perf: -2.92%
↗ Leadership gains (cross-up 20D MA vs SPY)
None on the close
↘ Leadership losses (cross-down 20D MA vs SPY)
• GDX - VanEck Gold Miners ETF · 20D relative perf: -9.78%
COMMODITIES
↗ Price breakouts (cross-up 20D MA)
None on the close
↘ Price breakdowns (cross-down 20D MA)
None on the close
↗ Leadership gains (cross-up 20D MA vs SPY)
None on the close
↘ Leadership losses (cross-down 20D MA vs SPY)
• PDBC - Invesco Optimum Yield Diversified Commodity Strategy No K-1 ETF · 20D relative perf: +0.54%
• DBA - Invesco DB Agriculture · -2.27%
Romain Gandon
CEO, Quantlake
Disclaimer: This article is for informational and educational purposes only and does not constitute investment advice. Past performance is not indicative of future results.